| Title | Weekend | Week | Total | % Change | Total Weeks |
| 1 (new) |  | Independence Day (1996) | £7,005,905 | £7,005,905 | £7,005,905 | new | 1 |
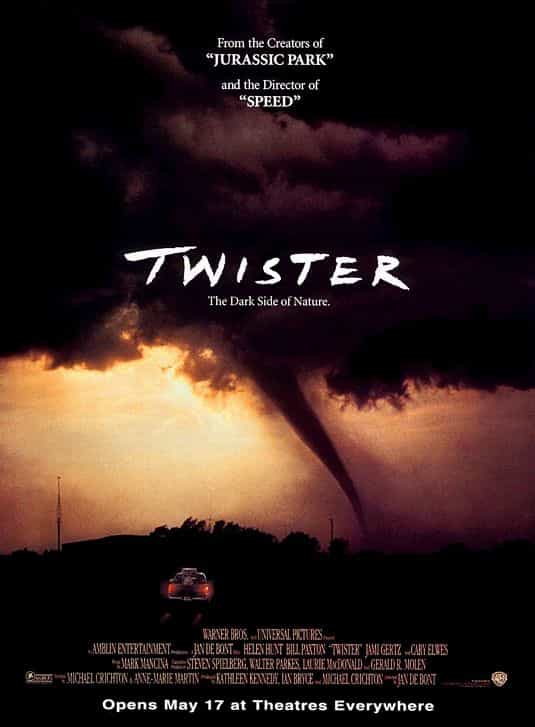
| 2 (1) |  | Twister (1996) | £2,028,710 | £2,637,323 | £8,188,057 | 12% | 3 |
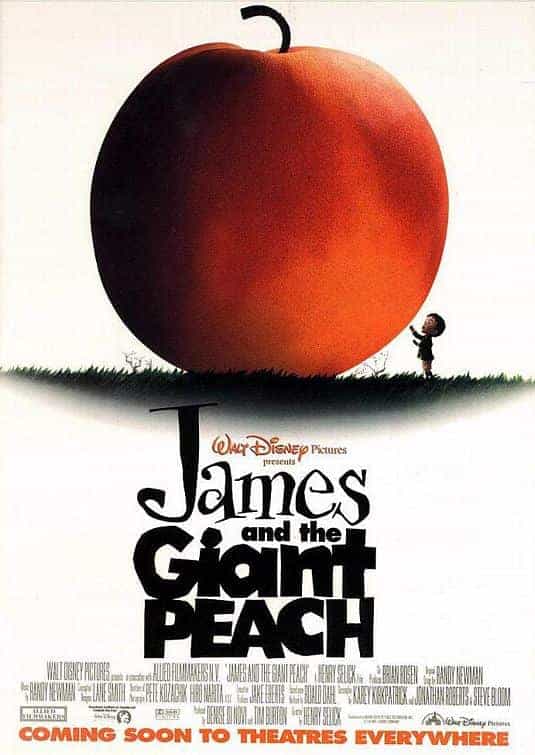
| 3 (2) |  | James and the Giant Peach (1996) | £1,067,295 | £1,440,848 | £3,208,333 | -40% | 2 |
| 4 (5) |  | Toy Story (1996) | £950,300 | £1,377,935 | £30,185,635 | 11% | 21 |
| 5 (7) |  | Mission:Impossible (1996) | £461,180 | £668,711 | £12,774,157 | -1% | 6 |
| 6 (3) |  | The Hunchback of Notre Dame (1996) | £425,695 | £595,973 | £6,509,105 | -58% | 4 |
| 7 (4) |  | Flipper (1996) | £328,463 | £476,271 | £1,384,716 | -64% | 2 |
| 8 (9) |  | Kingpin (1996) | £205,749 | £288,049 | £2,202,821 | -23% | 5 |
| 9 (6) |  | The Cable Guy (1996) | £202,177 | £283,048 | £6,400,609 | -57% | 5 |
| 10 (new) |  | August (1996) | £184,541 | £184,541 | £184,541 | new | 1 |
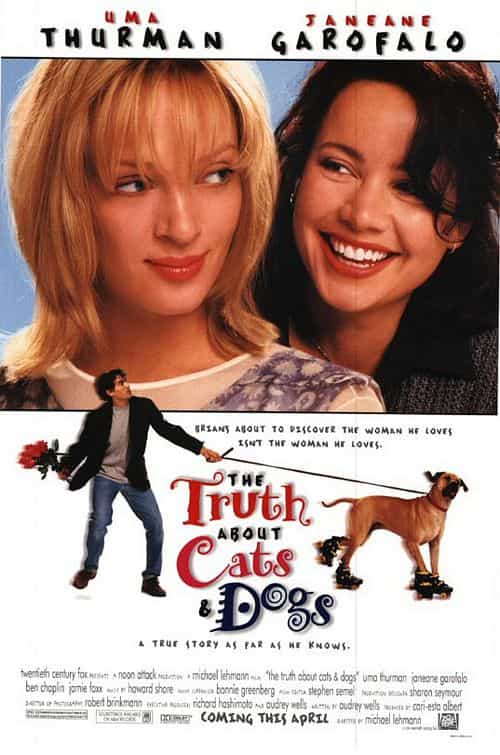
| 11 (8) |  | The Truth About Cats & Dogs (1996) | £171,197 | £222,556 | £2,116,733 | -39% | 4 |
| 12 (new) | | Last Dance (1996) | £157,221 | £157,221 | £157,221 | new | 1 |
| 13 (11) |  | The Rock (1996) | £110,504 | £143,655 | £6,518,941 | -15% | 8 |
| 14 (10) |  | Happy Gilmore (1996) | £49,187 | £71,321 | £1,162,738 | -70% | 4 |
| 15 (13) |  | Fargo (1996) | £24,741 | £32,163 | £1,533,908 | -14% | 11 |


