| Title | Weekend | Week | Total | % Change | Total Weeks |
| 1 (new) |  | Scream 2 (1998) | £2,493,950 | £2,493,950 | £2,493,950 | new | 1 |
| 2 (new) |  | Sliding Doors (1998) | £1,134,641 | £1,134,641 | £1,134,641 | new | 1 |
| 3 (new) |  | Breakdown (1998) | £589,478 | £589,478 | £589,478 | new | 1 |
| 4 (2) |  | Titanic (1997) | £526,477 | £1,710,744 | £58,696,368 | -21% | 15 |
| 5 (1) |  | U.S. Marshals (1998) | £386,810 | £560,875 | £1,340,887 | -50% | 2 |
| 6 (3) |  | Jackie Brown (1998) | £258,922 | £375,437 | £5,081,124 | -50% | 7 |
| 7 (5) |  | As Good As It Gets (1997) | £257,978 | £361,169 | £7,009,021 | -37% | 8 |
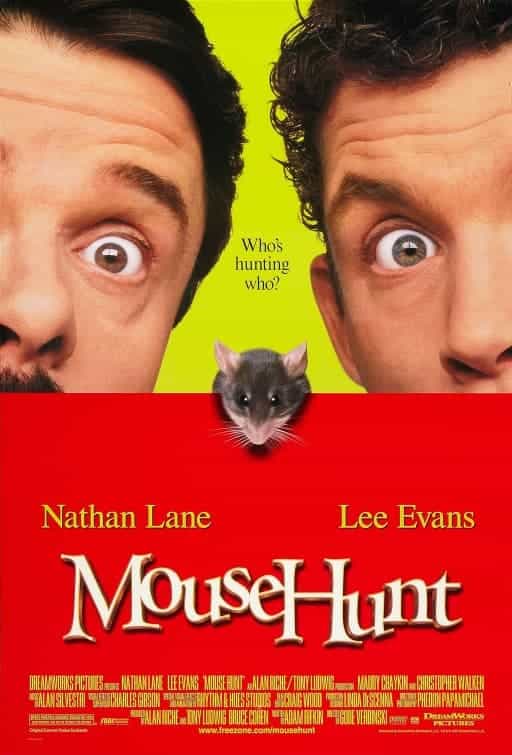
| 8 (6) |  | Mousehunt (1998) | £229,315 | £298,110 | £4,395,801 | -38% | 5 |
| 9 (7) |  | The Rainmaker (1998) | £158,636 | £214,159 | £553,624 | -53% | 2 |
| 10 (8) |  | Anastasia (1997) | £151,272 | £211,781 | £3,096,964 | -43% | 5 |
| 11 (9) |  | The Big Lebowski (1998) | £122,064 | £176,993 | £348,537 | -29% | 2 |
| 12 (4) |  | Great Expectations (1998) | £115,727 | £150,445 | £1,377,012 | -72% | 3 |
| 13 (10) |  | Deconstructing Harry (1998) | £56,320 | £78,848 | £466,249 | -57% | 3 |
| 14 (11) |  | Good Will Hunting (1998) | £48,240 | £67,536 | £6,246,297 | -60% | 9 |
| 15 (14) |  | Sphere (1998) | £19,500 | £27,300 | £1,856,297 | -61% | 6 |


