| Title | Weekend | Week | Total | % Change | Total Weeks |
| 1 (new) |  | The Hunger Games (2012) | £4,900,177 | £4,900,177 | £4,900,177 | new | 1 |
| 2 (2) |  | 21 Jump Street (2012) | £1,184,044 | £2,391,894 | £3,947,933 | -24% | 2 |
| 3 (3) |  | The Best Exotic Marigold Hotel (2012) | £747,122 | £1,818,911 | £15,674,349 | -51% | 5 |
| 4 (1) |  | The Devil Inside (2012) | £643,036 | £1,535,268 | £3,523,729 | -68% | 2 |
| 5 (5) | 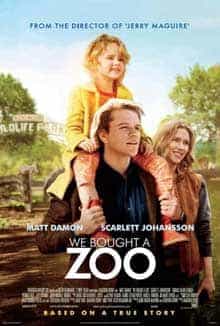 | We Bought a Zoo (2012) | £408,821 | £774,364 | £1,625,015 | -52% | 2 |
| 6 (6) | 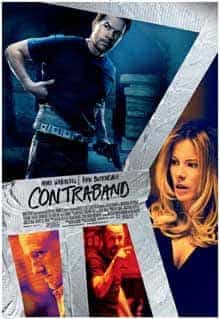 | Contraband (2012) | £315,666 | £802,331 | £1,485,985 | -54% | 2 |
| 7 (4) |  | John Carter (2012) | £297,762 | £692,303 | £4,504,680 | -69% | 3 |
| 8 (new) |  | Act of Valour (2012) | £262,935 | £262,935 | £262,935 | new | 1 |
| 9 (7) | 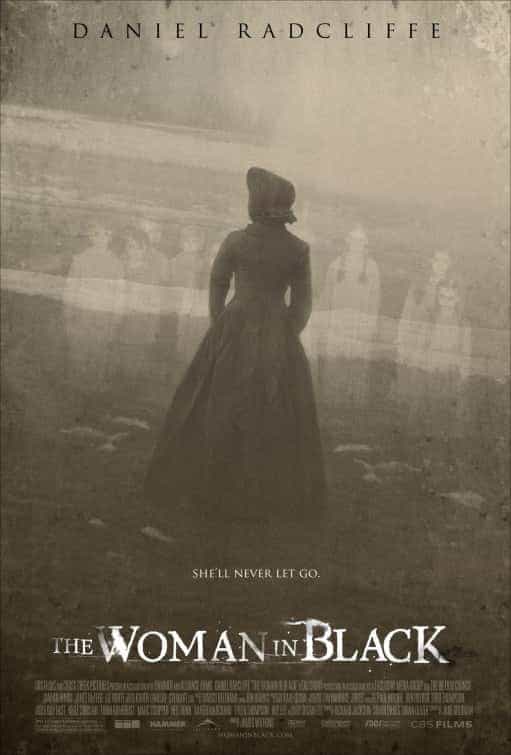 | The Woman In Black (2012) | £214,401 | £458,505 | £20,932,300 | -61% | 7 |
| 10 (9) |  | The Muppets (2011) | £168,381 | £261,398 | £16,061,283 | -57% | 7 |
| 11 (new) | | Agent Vinod (2012) | £159,760 | £159,760 | £159,760 | new | 1 |
| 12 (8) | 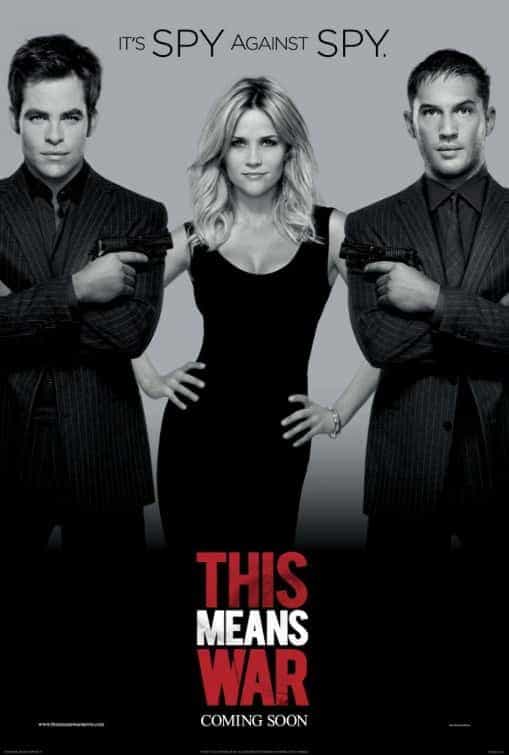 | This Means War (2012) | £119,260 | £323,725 | £4,826,653 | -72% | 4 |
| 13 (11) |  | Project X (2012) | £68,503 | £178,593 | £2,067,887 | -49% | 4 |
| 14 (new) |  | The Kid With a Bike (2012) | £66,822 | £66,822 | £66,822 | new | 1 |
| 15 (10) | 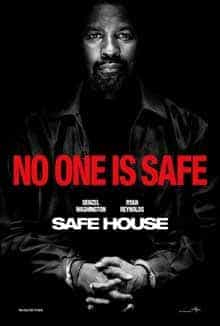 | Safe House (2012) | £66,688 | £216,765 | £6,996,243 | -75% | 5 |


