| Title | Weekend | Week | Total | % Change | Total Weeks |
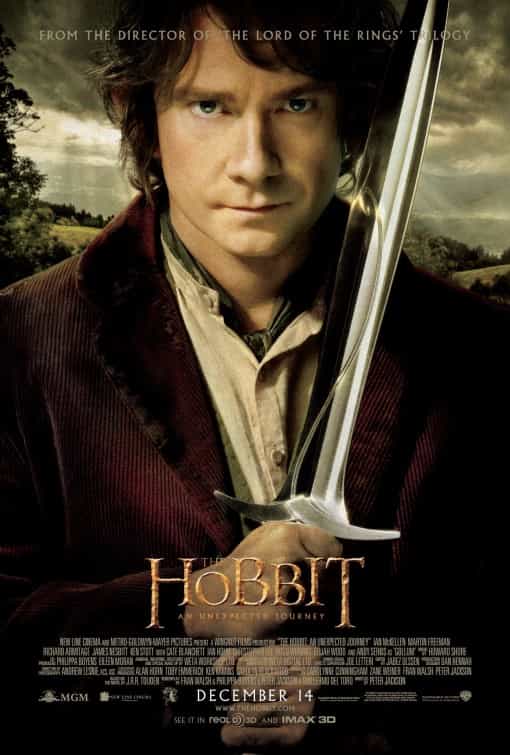
| 1 (1) |  | The Hobbit: An Unexpected Journey (2012) | £5,947,535 | £12,098,847 | £23,700,385 | -49% | 2 |
| 2 (new) |  | Life of Pi (2012) | £3,591,458 | £3,591,458 | £3,591,458 | new | 1 |
| 3 (2) |  | Rise of the Guardians (2012) | £1,215,027 | £1,727,450 | £7,441,112 | -3% | 4 |
| 4 (3) |  | Nativity 2: Danger In the Manger! (2012) | £1,182,078 | £1,744,669 | £7,326,893 | 21% | 5 |
| 5 (new) |  | Pitch Perfect (2012) | £947,058 | £947,058 | £947,058 | new | 1 |
| 6 (4) |  | Skyfall (2012) | £552,153 | £593,824 | £98,491,228 | -32% | 9 |
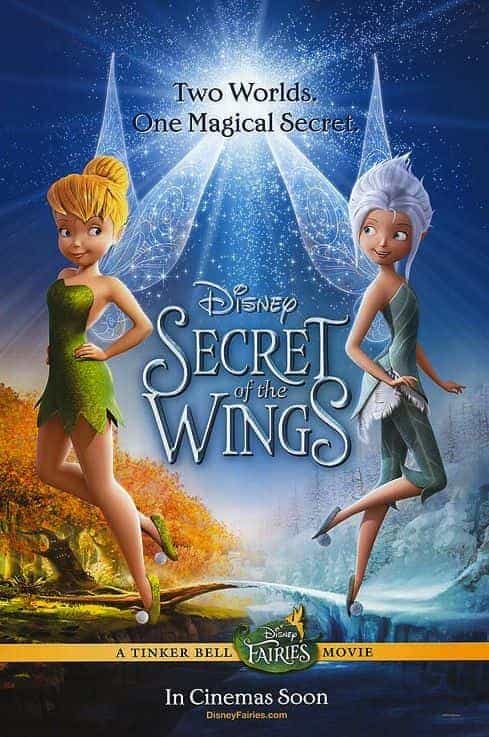
| 7 (5) |  | Tinker Bell and the Secret of the Wings (2012) | £467,140 | £680,661 | £1,209,481 | -12% | 2 |
| 8 (6) |  | The Twilight Saga: Breaking Dawn Part 2 (2012) | £230,583 | £423,899 | £34,843,971 | -55% | 6 |
| 9 (7) |  | Seven Psychopaths (2012) | £167,062 | £498,075 | £2,632,023 | -63% | 3 |
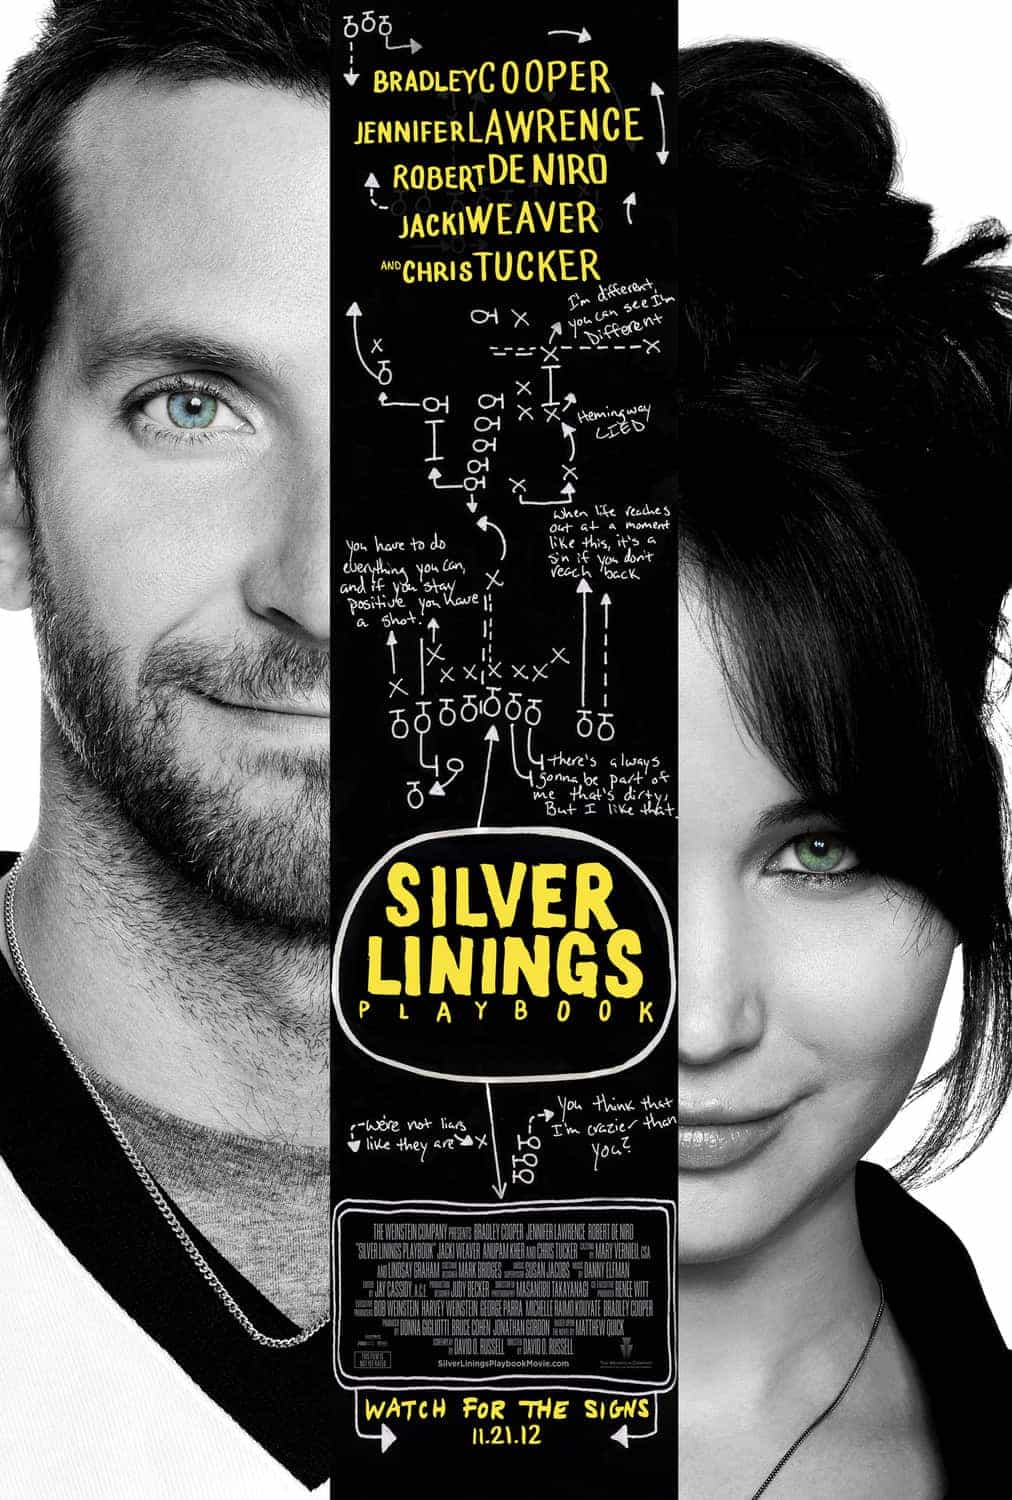
| 10 (8) |  | Silver Linings Playbook (2012) | £91,613 | £242,179 | £4,346,811 | -60% | 5 |
| 11 (11) |  | Arthur Christmas (2011) | £64,701 | £71,801 | £21,175,045 | -34% | 19 |
| 12 (9) |  | Argo (2012) | £54,877 | £118,434 | £5,271,696 | -49% | 7 |
| 13 (10) |  | Great Expectations (2012) | £31,430 | £148,100 | £1,879,025 | -69% | 4 |
| 14 (13) |  | Madagascar 3: Europes Most Wanted (2012) | £19,930 | £74,392 | £22,002,672 | -64% | 10 |
| 15 (12) | | Talaash (2012) | £16,696 | £46,673 | £886,048 | -73% | 4 |


