| Title | Weekend | Week | Total | % Change | Total Weeks |
| 1 (1) |  | The Hobbit: An Unexpected Journey (2012) | £4,075,781 | £9,019,162 | £44,870,320 | -41% | 4 |
| 2 (new) |  | The Impossible (2013) | £4,034,470 | £4,034,470 | £4,034,470 | new | 1 |
| 3 (2) |  | Life of Pi (2012) | £3,353,579 | £7,147,371 | £17,857,428 | -20% | 3 |
| 4 (new) |  | Quartet (2012) | £2,294,917 | £2,294,917 | £2,294,917 | new | 1 |
| 5 (3) |  | Jack Reacher (2012) | £1,682,561 | £3,585,253 | £7,160,319 | -53% | 2 |
| 6 (4) |  | Pitch Perfect (2012) | £917,135 | £1,986,886 | £4,928,013 | -29% | 3 |
| 7 (5) |  | Parental Guidance (2012) | £884,319 | £2,077,622 | £3,371,022 | -32% | 2 |
| 8 (6) |  | Rise of the Guardians (2012) | £725,281 | £1,745,712 | £11,247,265 | -29% | 6 |
| 9 (7) |  | Skyfall (2012) | £541,401 | £1,111,814 | £101,572,493 | -39% | 11 |
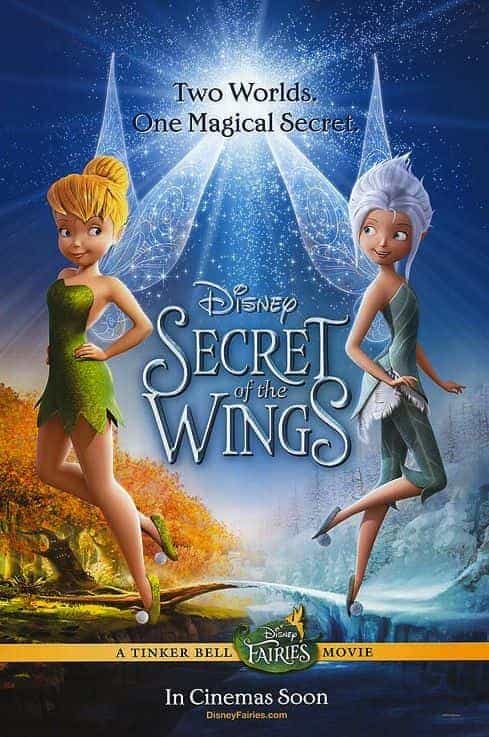
| 10 (8) |  | Tinker Bell and the Secret of the Wings (2012) | £516,952 | £1,164,698 | £3,375,684 | -17% | 4 |
| 11 (new) |  | Playing For Keeps (2012) | £507,319 | £507,319 | £507,319 | new | 1 |
| 12 (9) |  | Nativity 2: Danger In the Manger! (2012) | £149,703 | £442,463 | £9,084,150 | -61% | 7 |
| 13 (10) |  | The Twilight Saga: Breaking Dawn Part 2 (2012) | £88,690 | £197,568 | £35,602,742 | -65% | 8 |
| 14 (12) |  | Seven Psychopaths (2012) | £82,760 | £156,056 | £3,020,482 | -44% | 5 |
| 15 (13) |  | Dabangg 2 (2012) | £46,469 | £171,560 | £911,448 | -64% | 2 |


