UK Box Office 25th January, 2013
| Title | Weekend | Week | Total | % Change | Total Weeks | ||
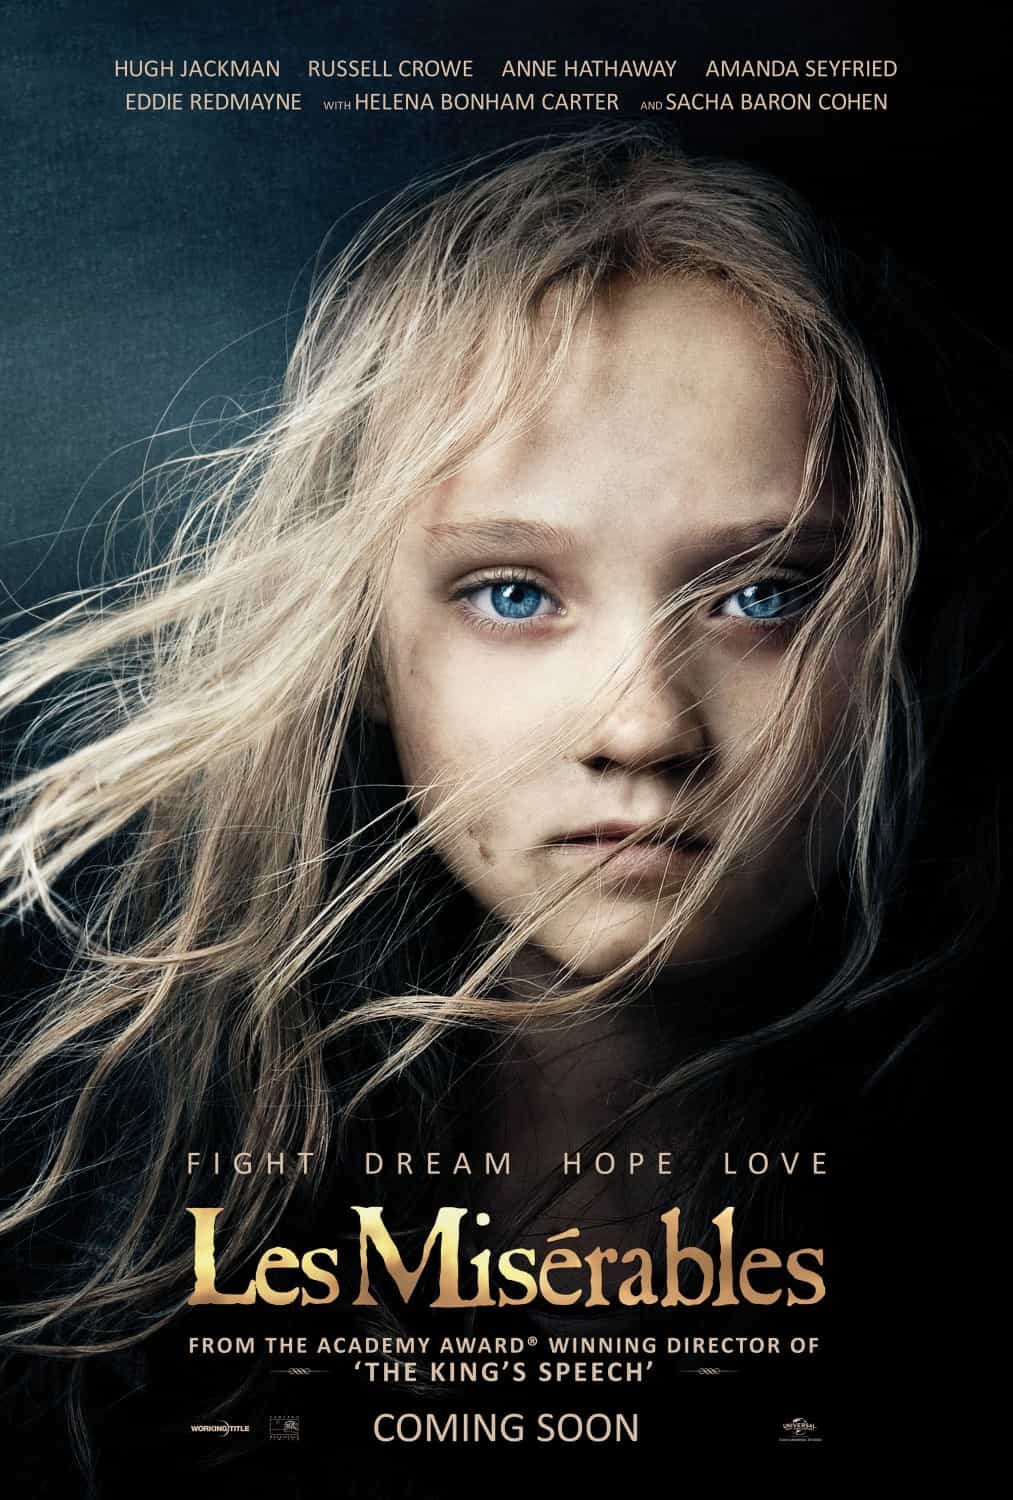
| 1 (1) |  | Les Misérables (2012) | £4,016,611 | £7,258,593 | £24,618,896 | -9% | 3 |
| 2 (2) |  | Django Unchained (2012) | £2,419,846 | £4,384,187 | £7,185,499 | -14% | 2 |
| 3 (new) |  | Lincoln (2012) | £1,657,337 | £1,657,337 | £1,657,337 | new | 1 |
| 4 (3) |  | Life of Pi (2012) | £1,119,570 | £1,809,545 | £25,957,044 | -7% | 6 |
| 5 (new) |  | Zero Dark Thirty (2012) | £1,052,845 | £1,052,845 | £1,052,845 | new | 1 |
| 6 (4) |  | The Impossible (2013) | £1,006,477 | £1,656,932 | £10,777,332 | -8% | 4 |
| 7 (new) |  | Movie 43 (2013) | £787,648 | £787,648 | £787,648 | new | 1 |
| 8 (7) |  | Monsters, Inc. (2001) Rerelease | £703,656 | £914,715 | £1,595,962 | 3% | 11 |
| 9 (6) |  | The Hobbit: An Unexpected Journey (2012) | £623,889 | £1,023,608 | £51,020,811 | -18% | 7 |
| 10 (new) |  | The Last Stand (2013) | £538,867 | £538,867 | £538,867 | new | 1 |
| 11 (5) |  | Gangster Squad (2013) | £359,150 | £859,894 | £4,750,236 | -55% | 3 |
| 12 (new) | Race 2 (2013) | £356,266 | £356,266 | £356,266 | new | 1 | |
| 13 (8) |  | Quartet (2012) | £266,703 | £798,273 | £6,702,776 | -25% | 4 |
| 14 (10) |  | Parental Guidance (2012) | £180,108 | £200,588 | £4,425,346 | -13% | 5 |
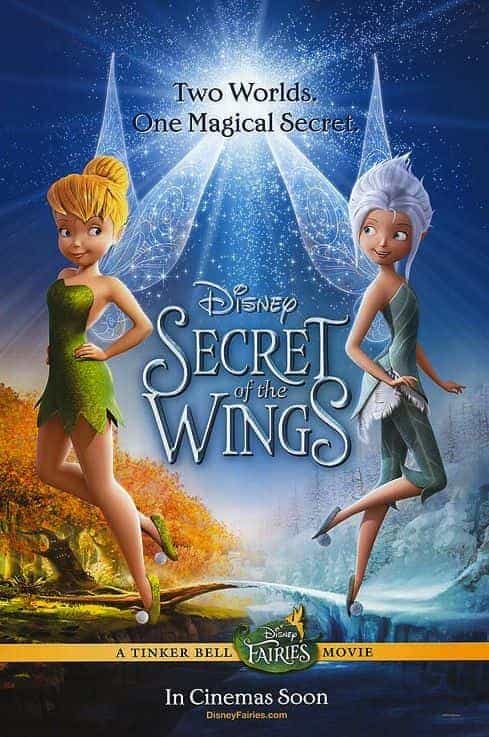
| 15 (14) |  | Tinker Bell and the Secret of the Wings (2012) | £123,151 | £133,438 | £3,932,050 | 11% | 7 |