| Title | Weekend | Week | Total | % Change | Total Weeks |
| 1 (new) |  | Hansel and Gretel: Witch Hunters (2013) | £1,502,782 | £1,502,782 | £1,502,782 | new | 1 |
| 2 (1) |  | Wreck-It Ralph (2012) | £1,402,000 | £1,807,481 | £20,432,173 | -59% | 4 |
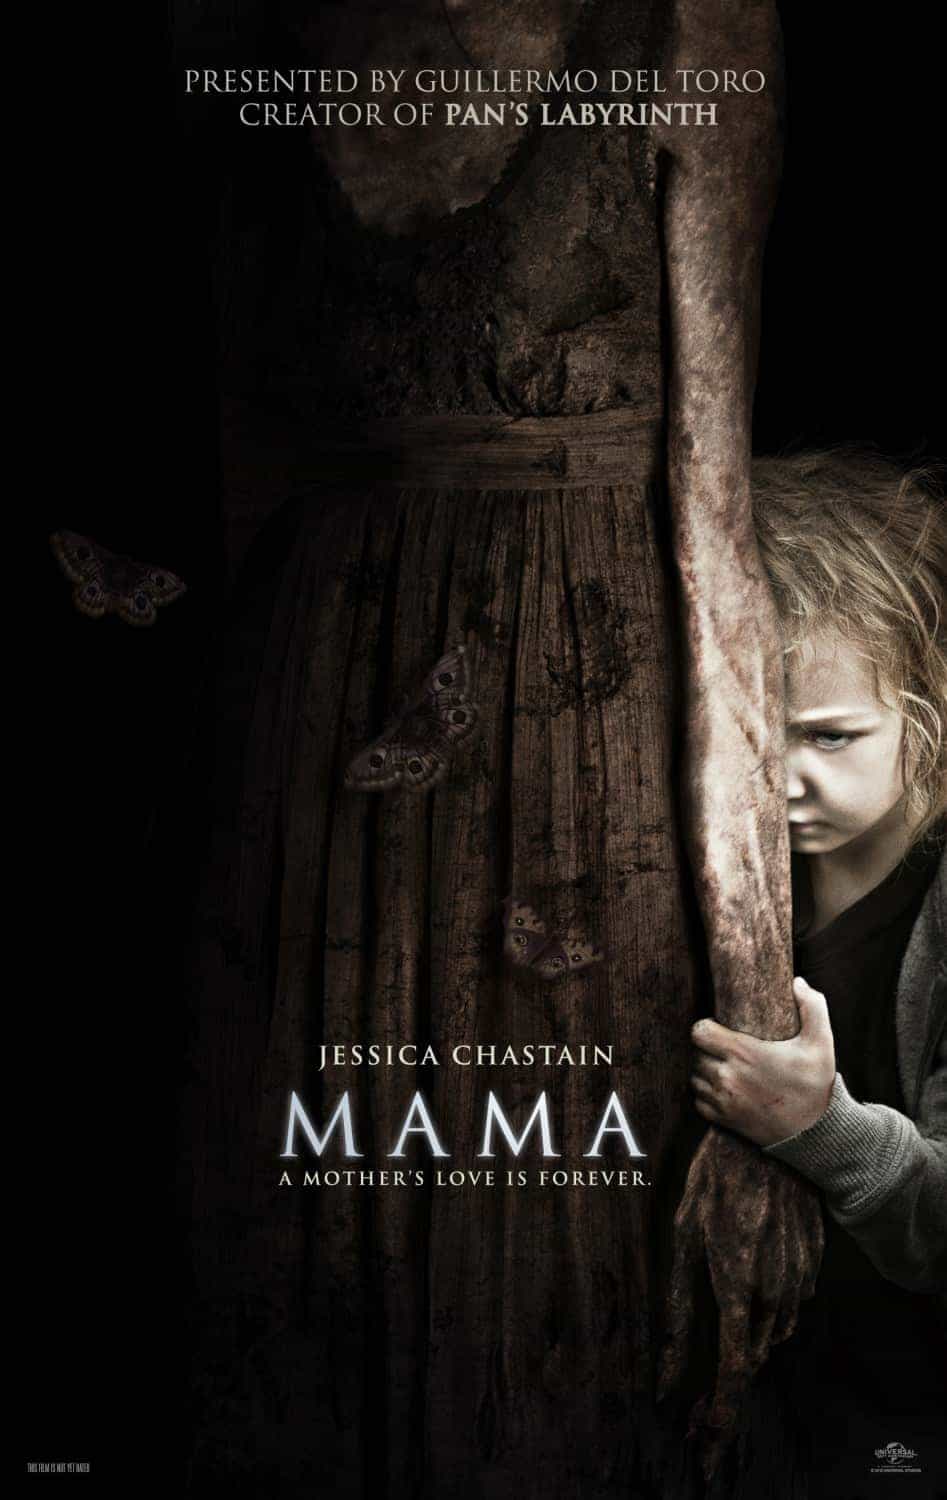
| 3 (3) |  | Mama (2013) | £1,066,008 | £1,972,377 | £3,484,674 | -30% | 2 |
| 4 (2) |  | A Good Day to Die Hard (2013) | £823,723 | £1,519,094 | £9,711,292 | -50% | 3 |
| 5 (new) |  | Safe Haven (2013) | £812,460 | £812,460 | £812,460 | new | 1 |
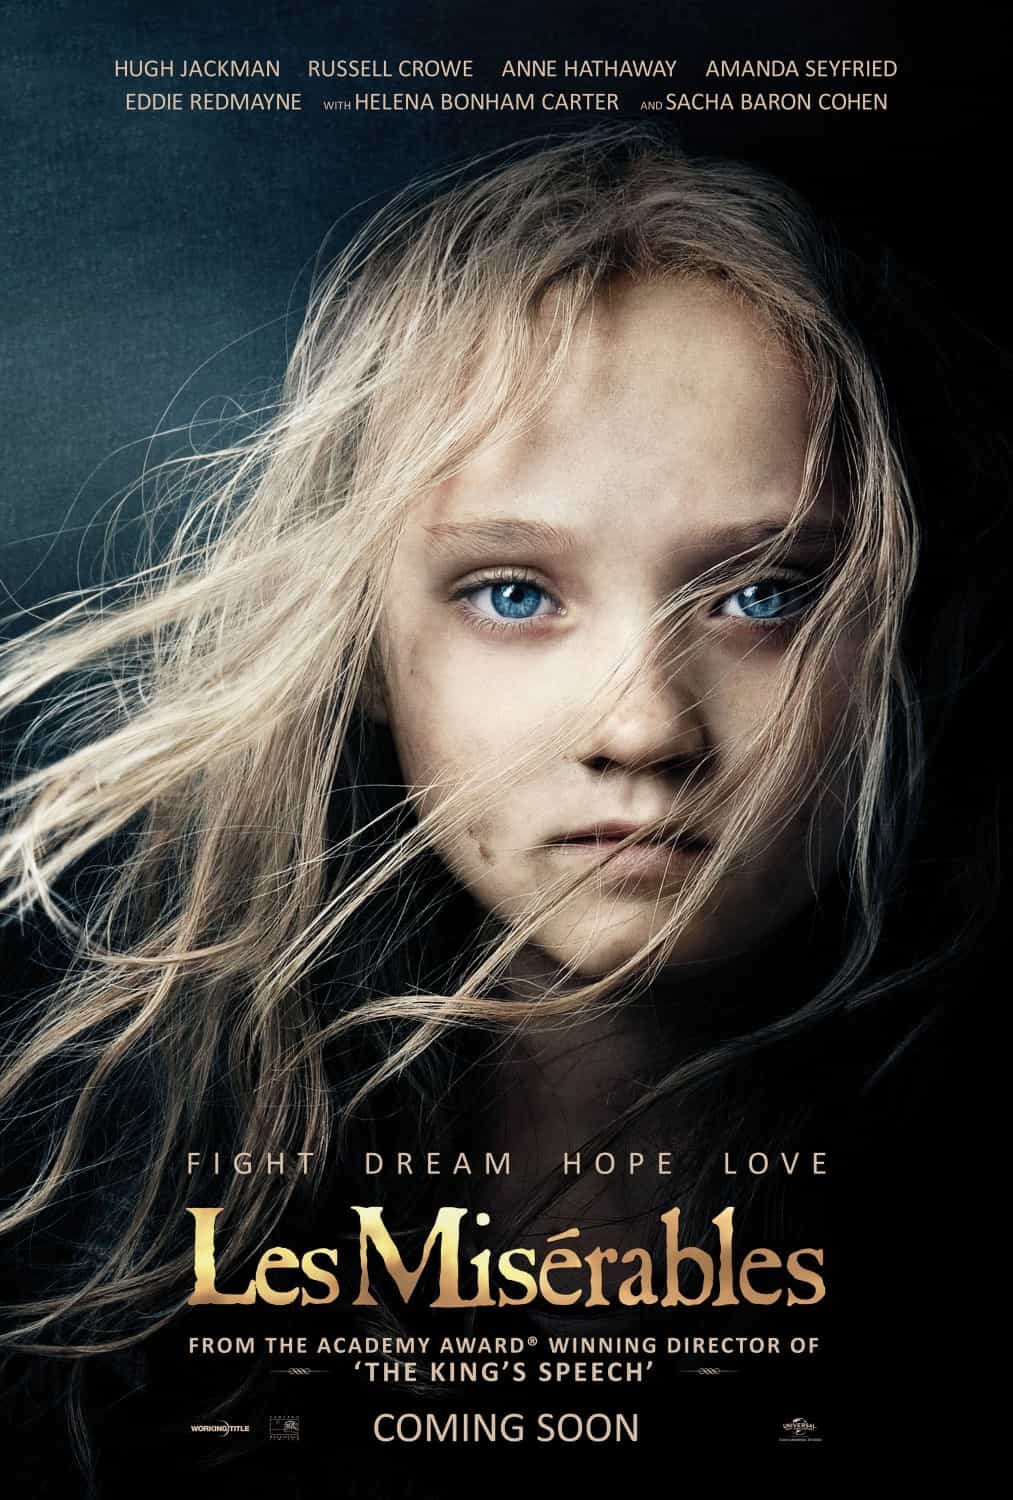
| 6 (4) |  | Les Misérables (2012) | £503,161 | £1,080,627 | £38,884,766 | -34% | 8 |
| 7 (new) |  | Broken City (2013) | £499,283 | £499,283 | £499,283 | new | 1 |
| 8 (13) |  | Argo (2012) | £408,903 | £702,359 | £7,065,703 | 42% | 12 |
| 9 (new) |  | Arbitrage (2013) | £402,873 | £402,873 | £402,873 | new | 1 |
| 10 (new) |  | Stoker (2013) | £367,509 | £367,509 | £367,509 | new | 1 |
| 11 (5) |  | I Give It a Year (2013) | £337,297 | £706,446 | £5,791,444 | -47% | 4 |
| 12 (6) |  | Cloud Atlas (2012) | £278,285 | £613,204 | £1,157,929 | -49% | 2 |
| 13 (9) |  | Django Unchained (2012) | £254,088 | £508,608 | £15,050,558 | -40% | 7 |
| 14 (11) |  | Lincoln (2012) | £234,605 | £544,827 | £8,184,848 | -28% | 6 |
| 15 (8) | | Song For Marion (2013) | £199,032 | £713,406 | £1,170,120 | -56% | 2 |


