| Title | Weekend | Week | Total | % Change | Total Weeks |
| 1 (new) |  | Oz the Great and Powerful (2013) | £3,712,948 | £3,712,948 | £3,712,948 | new | 1 |
| 2 (new) |  | Side Effects (2013) | £904,746 | £904,746 | £904,746 | new | 1 |
| 3 (2) |  | Wreck-It Ralph (2012) | £744,683 | £1,027,484 | £21,459,657 | -47% | 5 |
| 4 (new) |  | Parker (2013) | £568,777 | £568,777 | £568,777 | new | 1 |
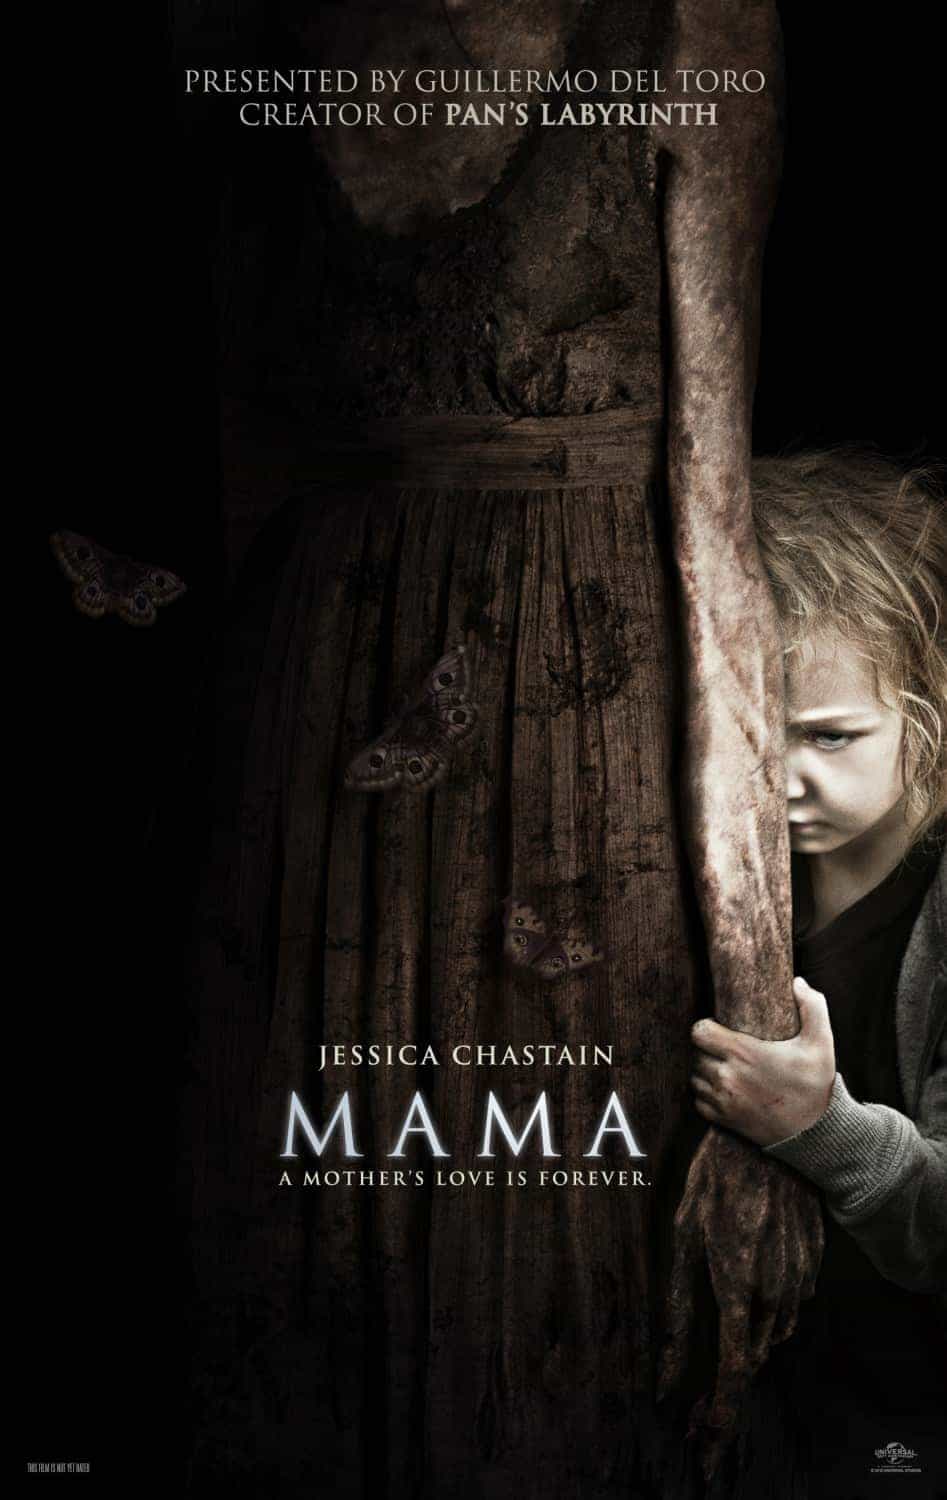
| 5 (3) |  | Mama (2013) | £525,672 | £1,045,621 | £4,530,295 | -51% | 3 |
| 6 (1) |  | Hansel and Gretel: Witch Hunters (2013) | £507,759 | £1,148,611 | £2,651,393 | -66% | 2 |
| 7 (new) |  | The Guilt Trip (2012) | £432,068 | £432,068 | £432,068 | new | 1 |
| 8 (5) |  | Safe Haven (2013) | £407,293 | £877,106 | £1,689,566 | -50% | 2 |
| 9 (4) |  | A Good Day to Die Hard (2013) | £342,415 | £690,665 | £10,401,957 | -58% | 4 |
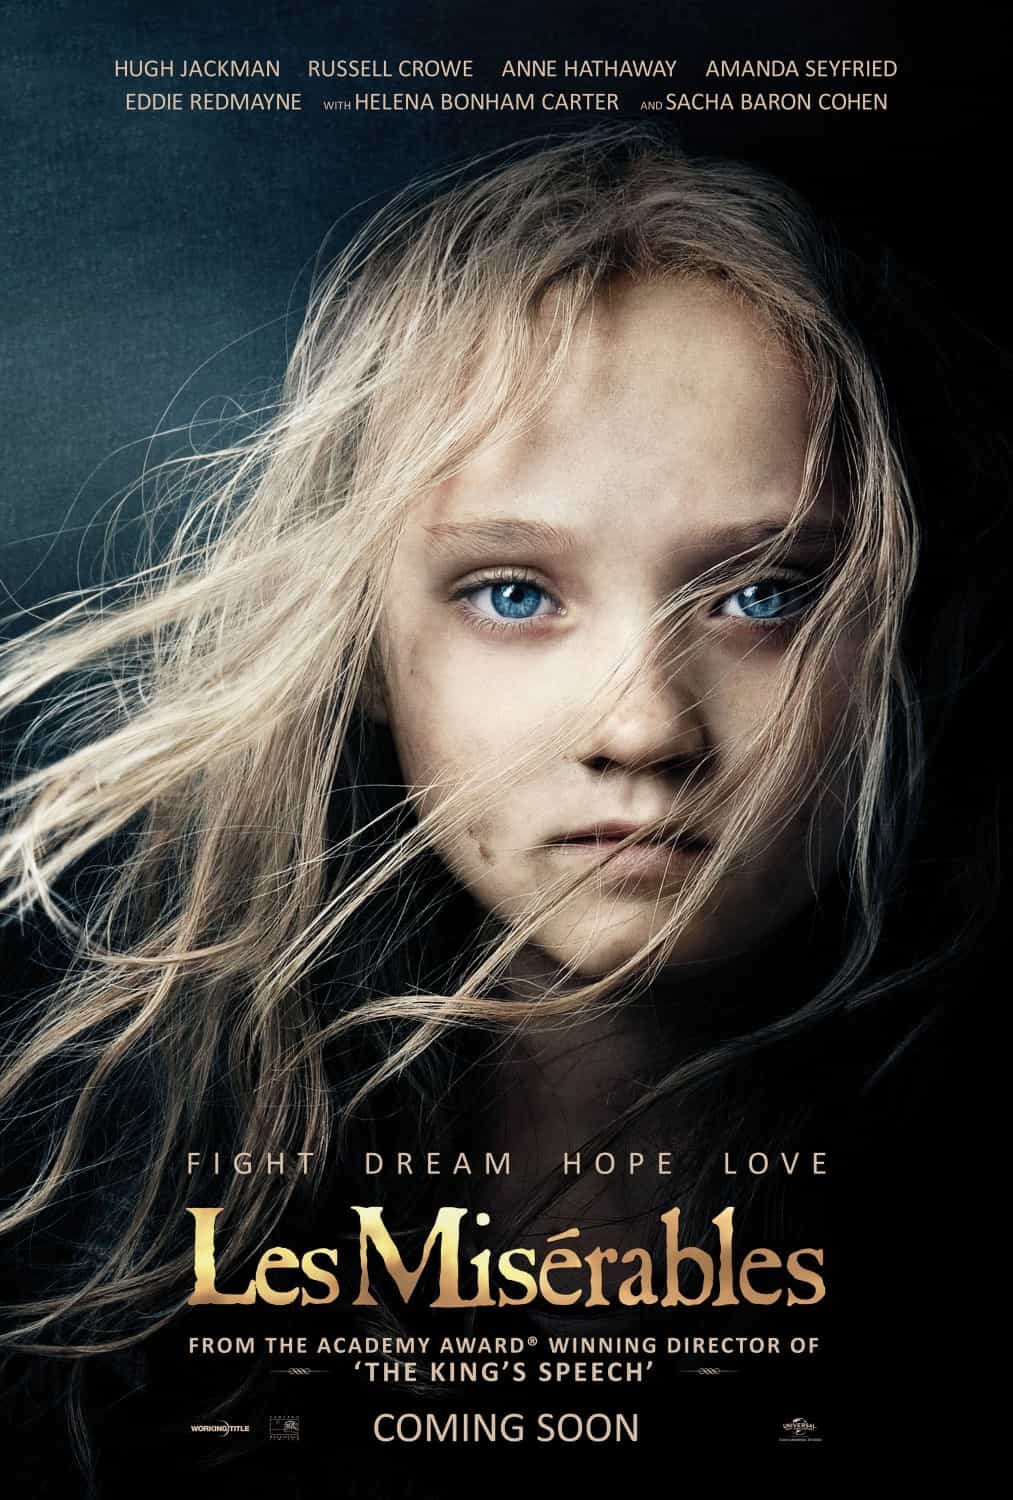
| 10 (6) |  | Les Misérables (2012) | £293,893 | £667,834 | £39,552,600 | -42% | 9 |
| 11 (8) |  | Argo (2012) | £197,283 | £422,662 | £7,488,365 | -52% | 13 |
| 12 (9) |  | Arbitrage (2013) | £177,655 | £430,884 | £833,757 | -56% | 2 |
| 13 (7) |  | Broken City (2013) | £130,185 | £437,134 | £936,417 | -74% | 2 |
| 14 (15) | | Song For Marion (2013) | £126,295 | £384,802 | £1,554,922 | -37% | 3 |
| 15 (new) | | Robot and Frank (2013) | £106,346 | £106,346 | £106,346 | new | 1 |


