| Title | Weekend | Week | Total | % Change | Total Weeks |
| 1 (1) |  | Oz the Great and Powerful (2013) | £2,609,475 | £3,970,751 | £7,683,699 | -30% | 2 |
| 2 (2) |  | Side Effects (2013) | £759,363 | £1,373,115 | £2,277,861 | -16% | 2 |
| 3 (new) |  | Welcome to the Punch (2013) | £460,250 | £460,250 | £460,250 | new | 1 |
| 4 (3) |  | Wreck-It Ralph (2012) | £426,343 | £536,292 | £21,995,949 | -43% | 6 |
| 5 (4) |  | Parker (2013) | £308,335 | £661,112 | £1,229,889 | -46% | 2 |
| 6 (new) |  | The Incredible Burt Wonderstone (2013) | £305,936 | £305,936 | £305,936 | new | 1 |
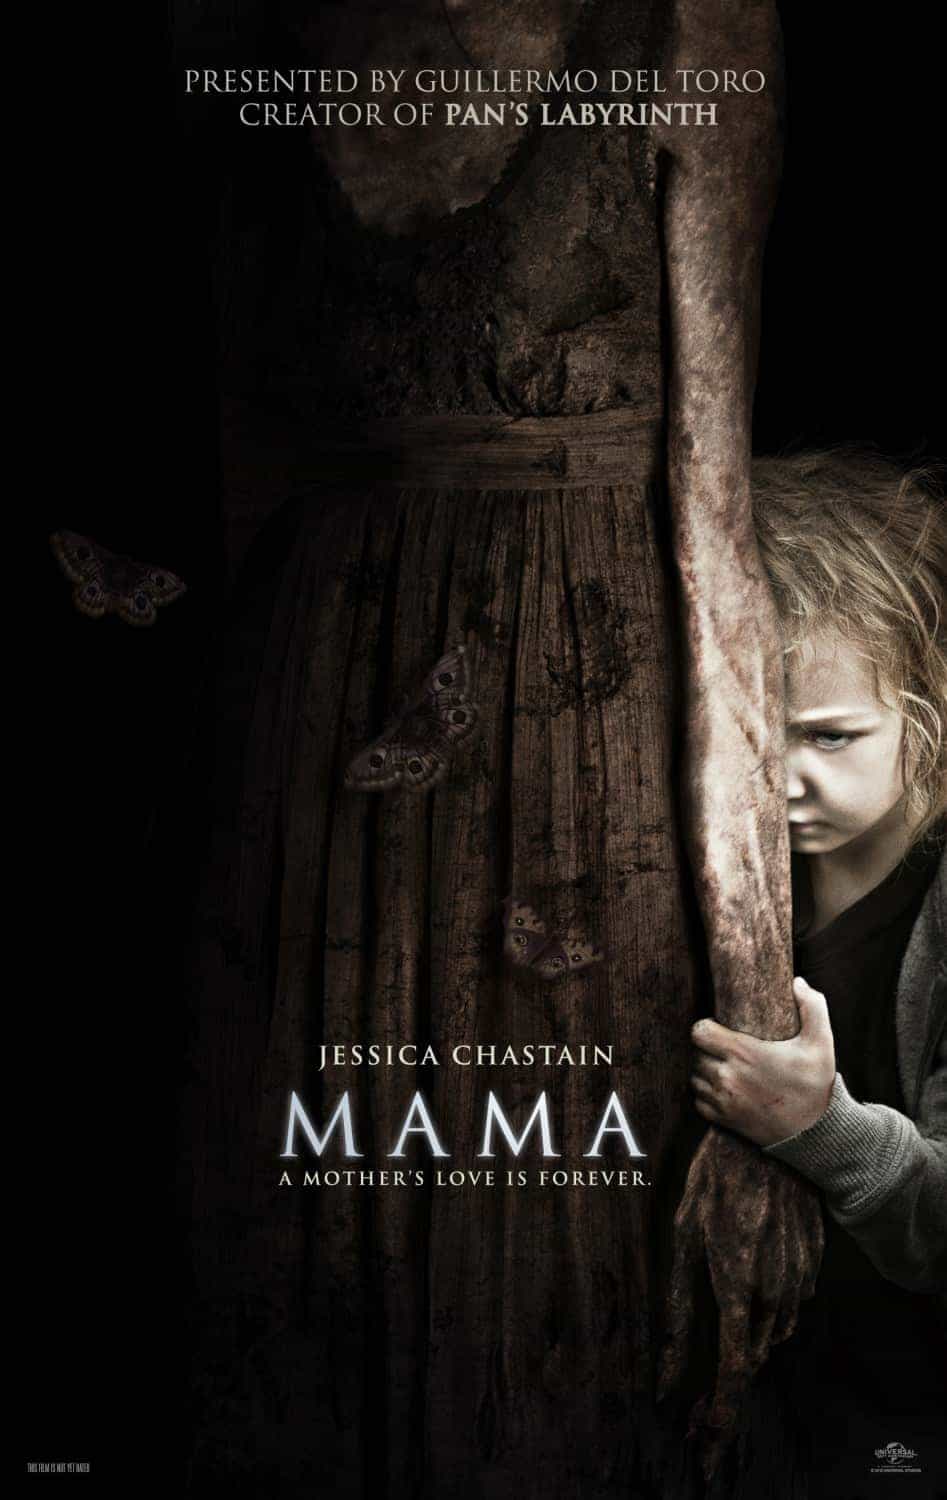
| 7 (5) |  | Mama (2013) | £266,521 | £524,388 | £5,054,683 | -49% | 4 |
| 8 (new) | | Red Dawn (2013) | £255,448 | £255,448 | £255,448 | new | 1 |
| 9 (6) |  | Hansel and Gretel: Witch Hunters (2013) | £221,452 | £526,924 | £3,178,317 | -56% | 3 |
| 10 (7) |  | The Guilt Trip (2012) | £157,016 | £382,462 | £814,530 | -64% | 2 |
| 11 (8) |  | Safe Haven (2013) | £155,090 | £386,740 | £2,076,306 | -62% | 3 |
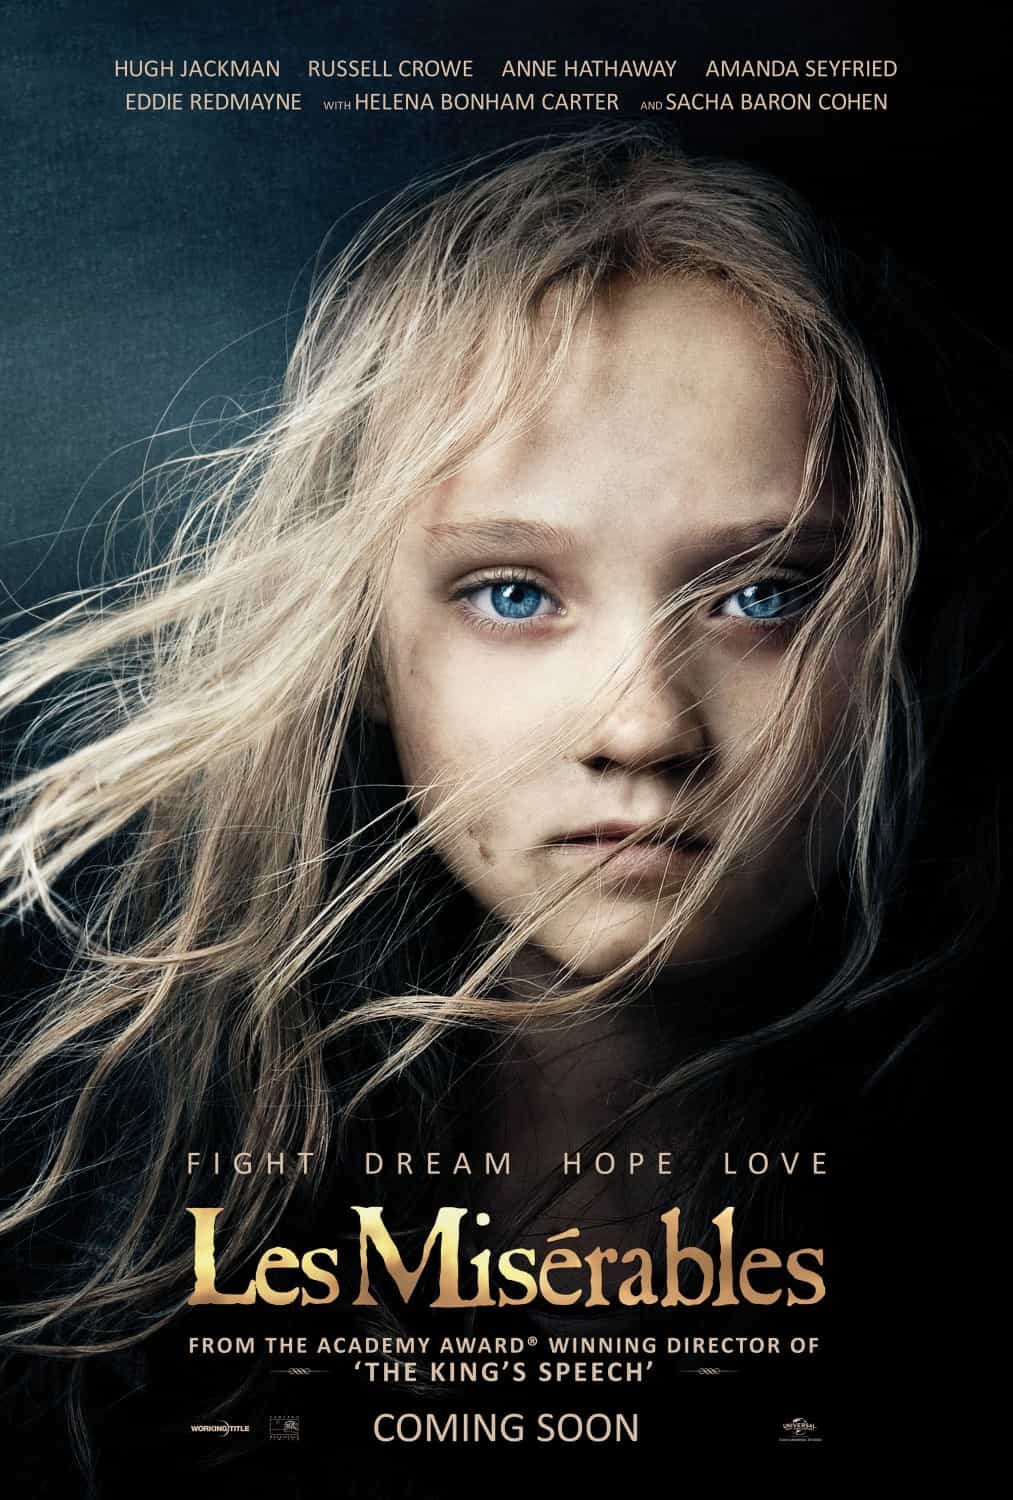
| 12 (10) |  | Les Misérables (2012) | £142,145 | £362,819 | £39,915,419 | -52% | 10 |
| 13 (new) |  | The Paperboy (2013) | £141,881 | £141,881 | £141,881 | new | 1 |
| 14 (9) |  | A Good Day to Die Hard (2013) | £117,988 | £284,454 | £10,686,411 | -66% | 5 |
| 15 (12) |  | Arbitrage (2013) | £112,587 | £210,096 | £1,043,853 | -37% | 3 |


