| Title | Weekend | Week | Total | % Change | Total Weeks |
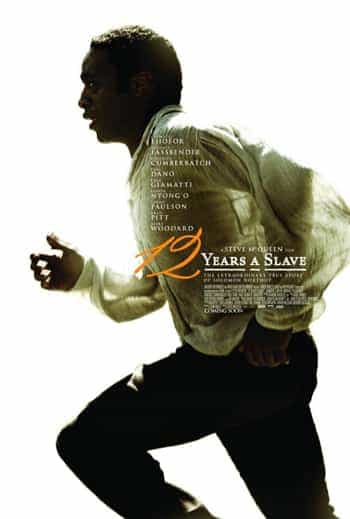
| 1 (new) |  | 12 Years a Slave (2013) | £2,511,349 | £2,511,349 | £2,511,349 | new | 1 |
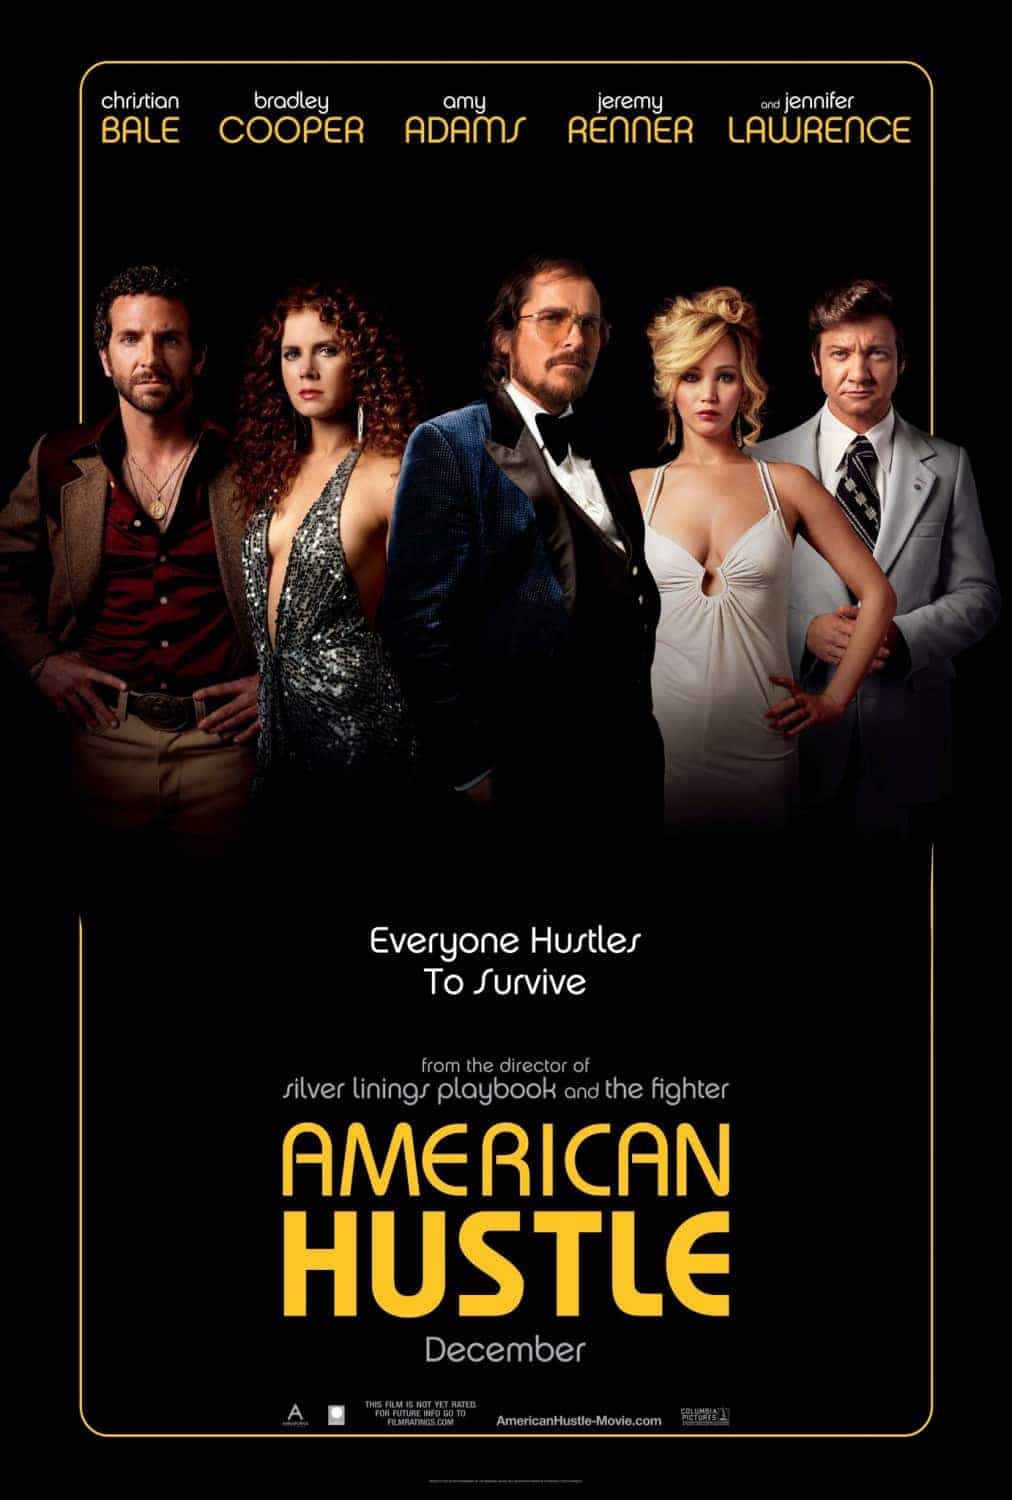
| 2 (1) |  | American Hustle (2014) | £1,938,805 | £3,147,148 | £6,779,242 | -44% | 3 |
| 3 (2) |  | The Hobbit: The Desolation of Smaug (2013) | £1,504,554 | £2,782,702 | £40,099,644 | -53% | 5 |
| 4 (3) |  | Frozen (2013) | £1,314,153 | £1,948,332 | £32,756,029 | -55% | 6 |
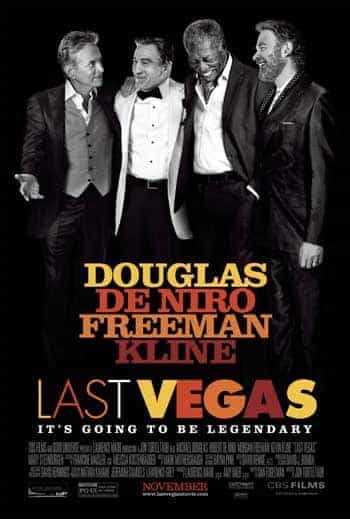
| 5 (4) |  | Last Vegas (2014) | £1,293,299 | £2,202,613 | £4,014,308 | -29% | 2 |
| 6 (new) |  | The Railway Man (2014) | £1,230,483 | £1,230,483 | £1,230,483 | new | 1 |
| 7 (new) |  | Delivery Man (2014) | £1,102,433 | £1,102,433 | £1,102,433 | new | 1 |
| 8 (7) |  | Mandela: Long Walk to Freedom (2014) | £783,624 | £1,578,609 | £3,051,109 | -47% | 2 |
| 9 (6) |  | Anchorman 2: The Legend Continues (2013) | £755,719 | £1,487,934 | £13,496,950 | -51% | 4 |
| 10 (5) |  | Paranormal Activity: The Marked Ones (2014) | £502,235 | £991,747 | £2,576,101 | -68% | 2 |
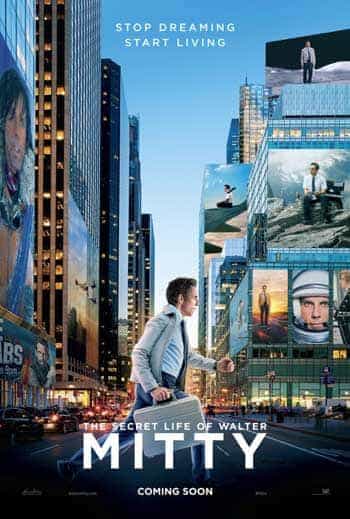
| 11 (8) |  | The Secret Life of Walter Mitty (2013) | £474,369 | £897,213 | £6,154,464 | -60% | 3 |
| 12 (9) |  | Walking With Dinosaurs (2013) | £368,272 | £536,852 | £5,010,838 | -51% | 4 |
| 13 (14) |  | Gravity (2013) | £335,715 | £511,128 | £28,167,264 | 24% | 10 |
| 14 (10) |  | The Hunger Games: Catching Fire (2013) | £299,048 | £497,109 | £33,492,985 | -44% | 8 |
| 15 (new) |  | Jilla (2014) | £152,552 | £152,552 | £152,552 | new | 1 |


