| Title | Weekend | Week | Total | % Change | Total Weeks |
| 1 (new) |  | The Wolf of Wall Street (2013) | £4,655,984 | £4,655,984 | £4,655,984 | new | 1 |
| 2 (1) | 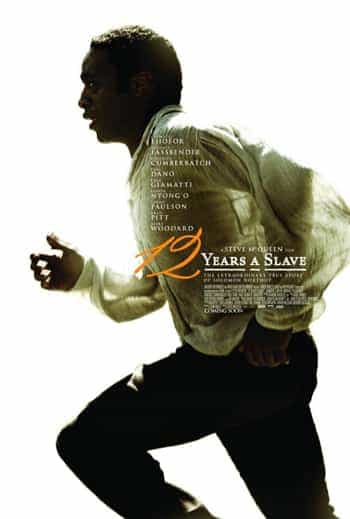 | 12 Years a Slave (2013) | £3,055,020 | £4,613,724 | £7,125,073 | 18% | 2 |
| 3 (2) | 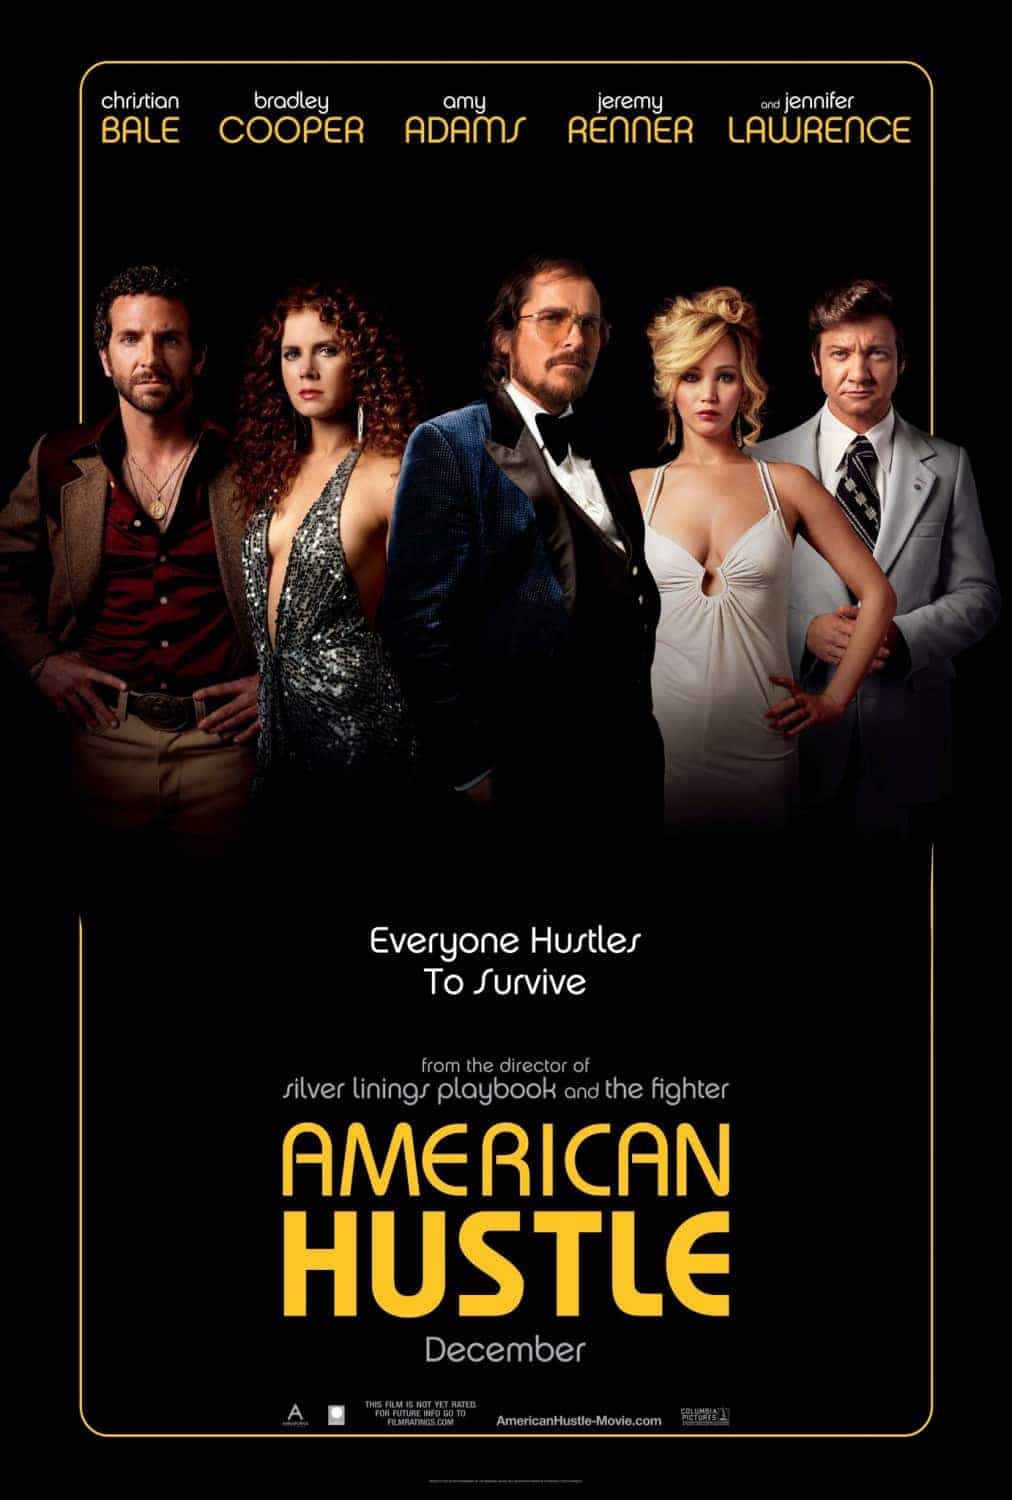 | American Hustle (2014) | £1,547,249 | £2,643,351 | £9,422,593 | -20% | 4 |
| 4 (4) |  | Frozen (2013) | £1,151,814 | £1,410,896 | £34,166,925 | -12% | 7 |
| 5 (new) |  | Devil's Due (2014) | £1,002,627 | £1,002,627 | £1,002,627 | new | 1 |
| 6 (3) |  | The Hobbit: The Desolation of Smaug (2013) | £847,078 | £1,489,703 | £41,589,347 | -44% | 6 |
| 7 (5) | 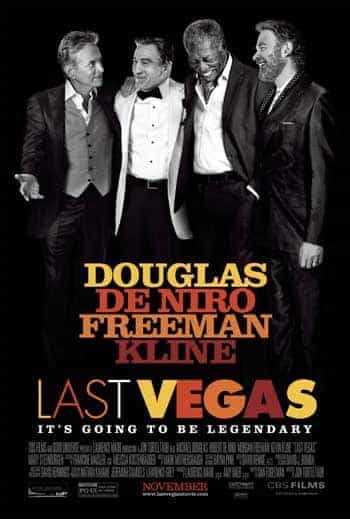 | Last Vegas (2014) | £830,499 | £1,428,583 | £5,442,891 | -36% | 3 |
| 8 (6) |  | The Railway Man (2014) | £776,512 | £1,797,656 | £3,028,139 | -37% | 2 |
| 9 (7) |  | Delivery Man (2014) | £670,753 | £1,137,670 | £2,240,103 | -39% | 2 |
| 10 (13) |  | Gravity (2013) | £497,188 | £681,662 | £28,848,926 | 32% | 11 |
| 11 (8) |  | Mandela: Long Walk to Freedom (2014) | £304,517 | £773,181 | £3,824,290 | -61% | 3 |
| 12 (12) |  | Walking With Dinosaurs (2013) | £267,838 | £300,781 | £5,311,619 | -27% | 5 |
| 13 (9) |  | Anchorman 2: The Legend Continues (2013) | £257,281 | £604,300 | £14,101,250 | -66% | 5 |
| 14 (14) |  | The Hunger Games: Catching Fire (2013) | £186,603 | £295,759 | £33,788,744 | -38% | 9 |
| 15 (11) | 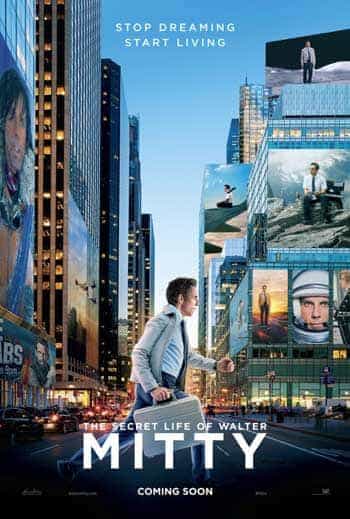 | The Secret Life of Walter Mitty (2013) | £169,309 | £354,935 | £6,509,399 | -64% | 4 |


