| Title | Weekend | Week | Total | % Change | Total Weeks |
| 1 (1) | 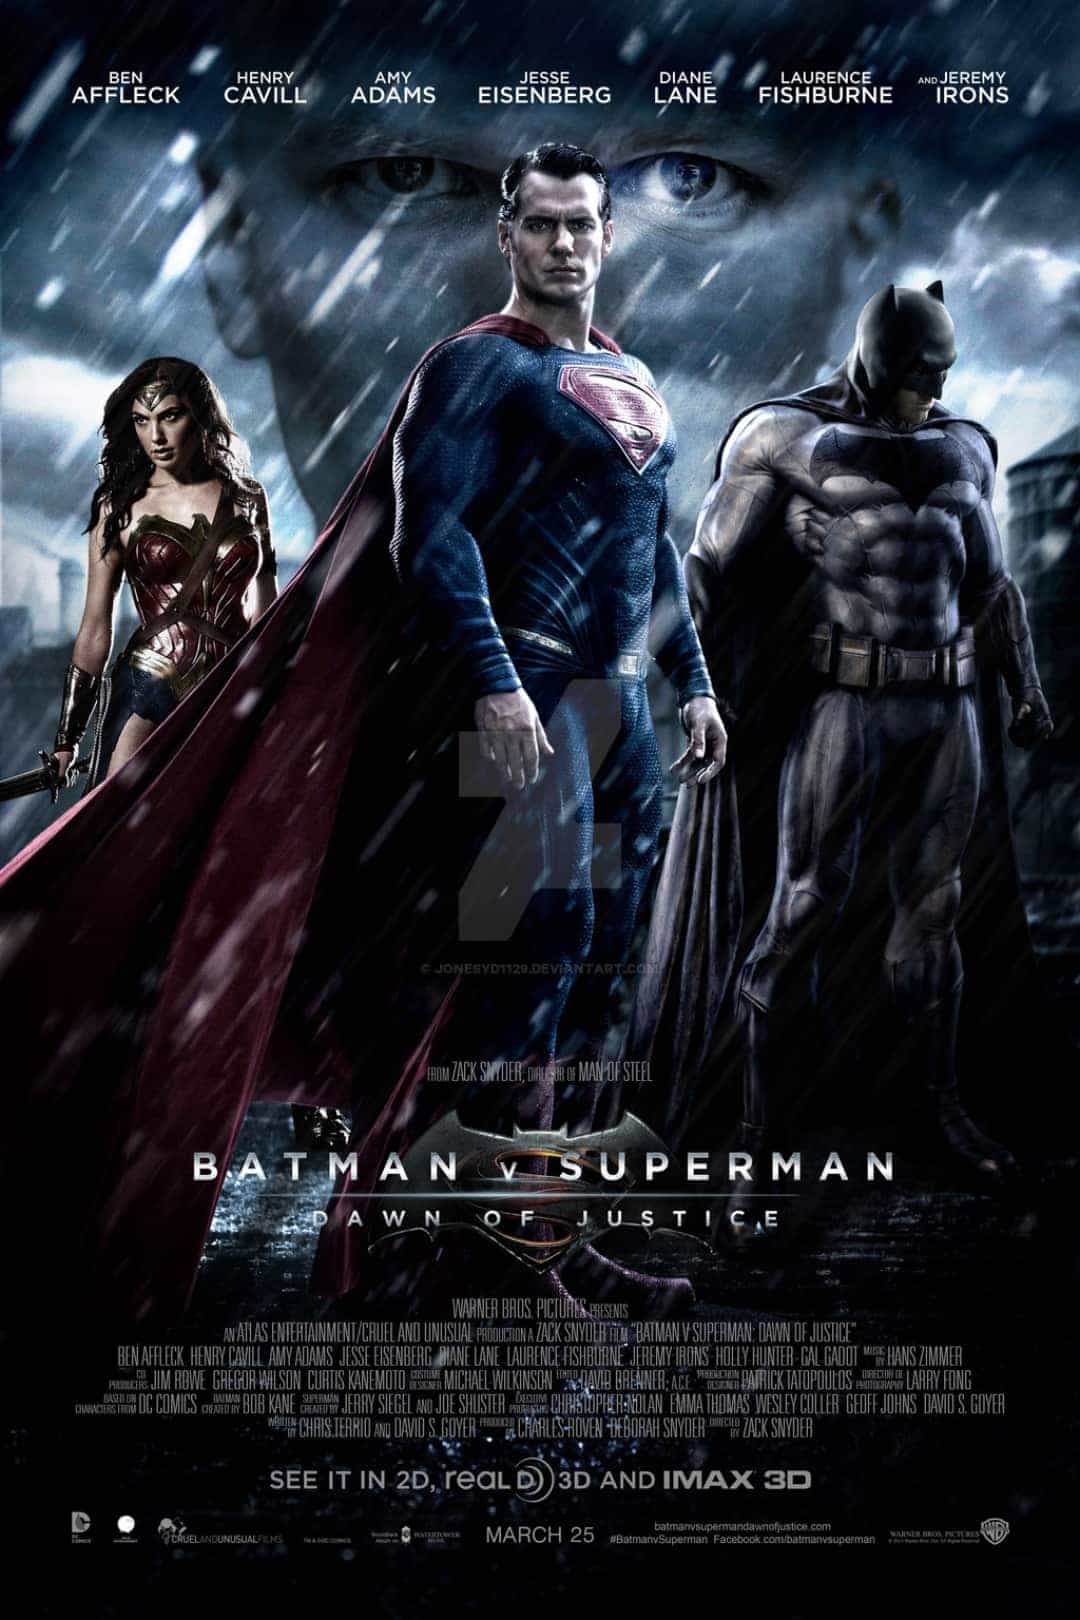 | Batman V Superman: Dawn of Justice (2016) | £4,661,959 | £13,208,120 | £27,829,127 | -68% | 2 |
| 2 (new) | 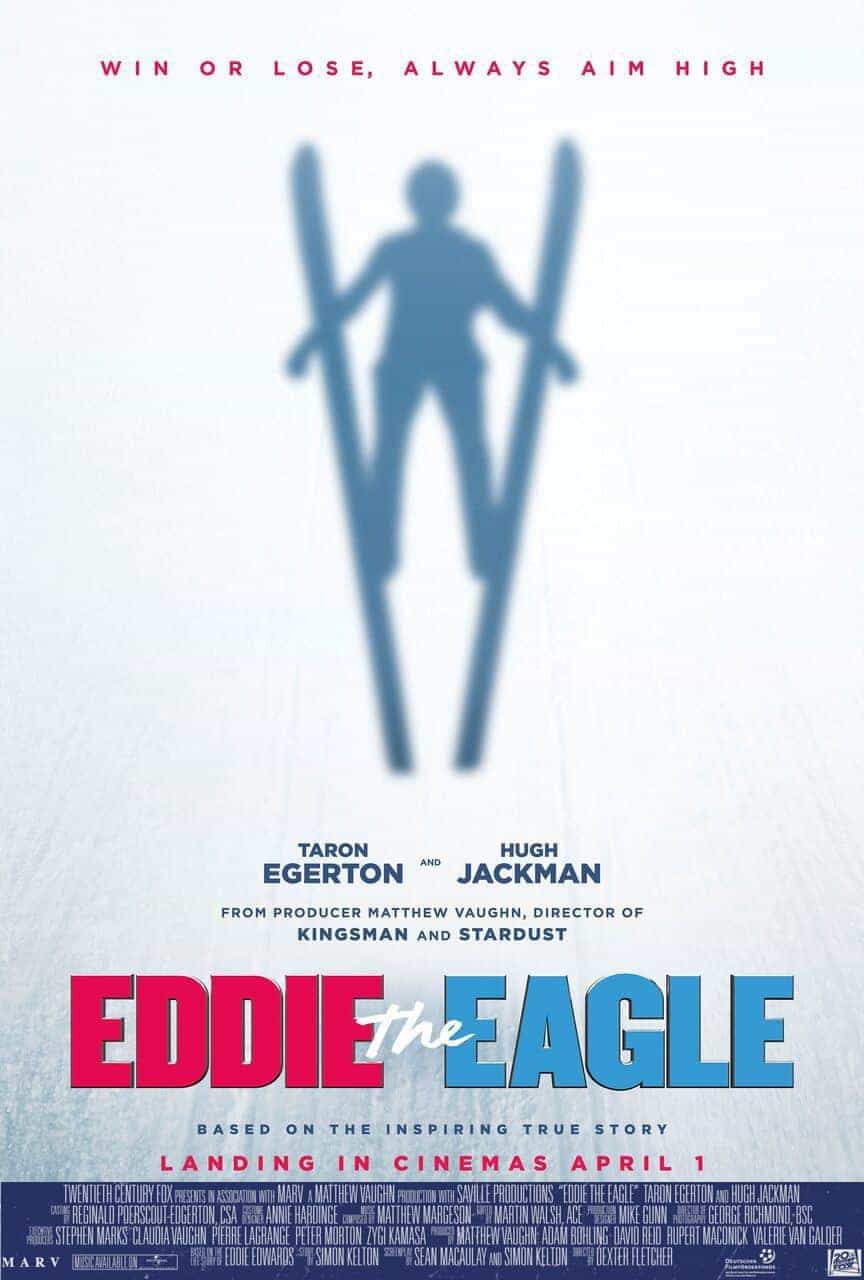 | Eddie the Eagle (2015) | £2,834,785 | £2,834,785 | £2,834,785 | new | 1 |
| 3 (2) | 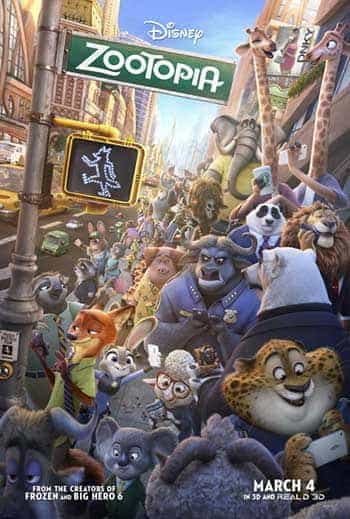 | Zootopia (2016) | £2,734,493 | £7,290,476 | £12,597,202 | -48% | 2 |
| 4 (3) |  | Kung-Fu Panda 3 (2016) | £761,699 | £2,186,230 | £11,147,832 | -36% | 4 |
| 5 (4) | 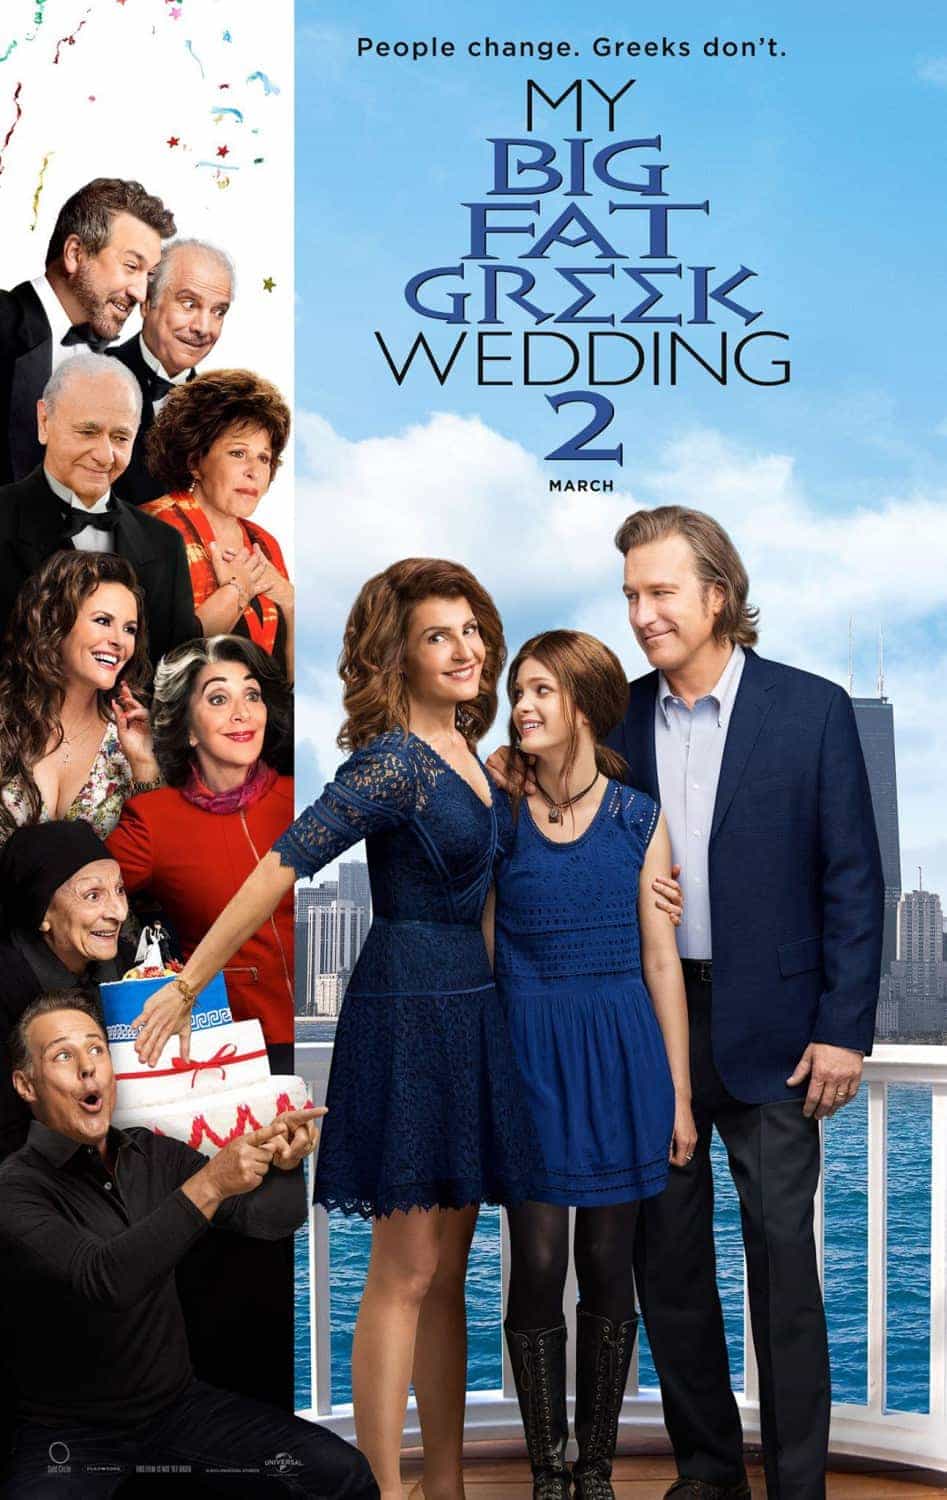 | My Big Fat Greek Wedding 2 (2016) | £614,594 | £1,496,543 | £2,480,077 | -38% | 2 |
| 6 (5) | 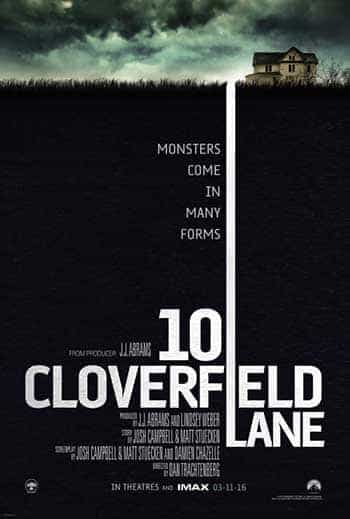 | 10 Cloverfield Lane (2016) | £481,242 | £1,135,628 | £4,462,425 | -38% | 3 |
| 7 (new) | 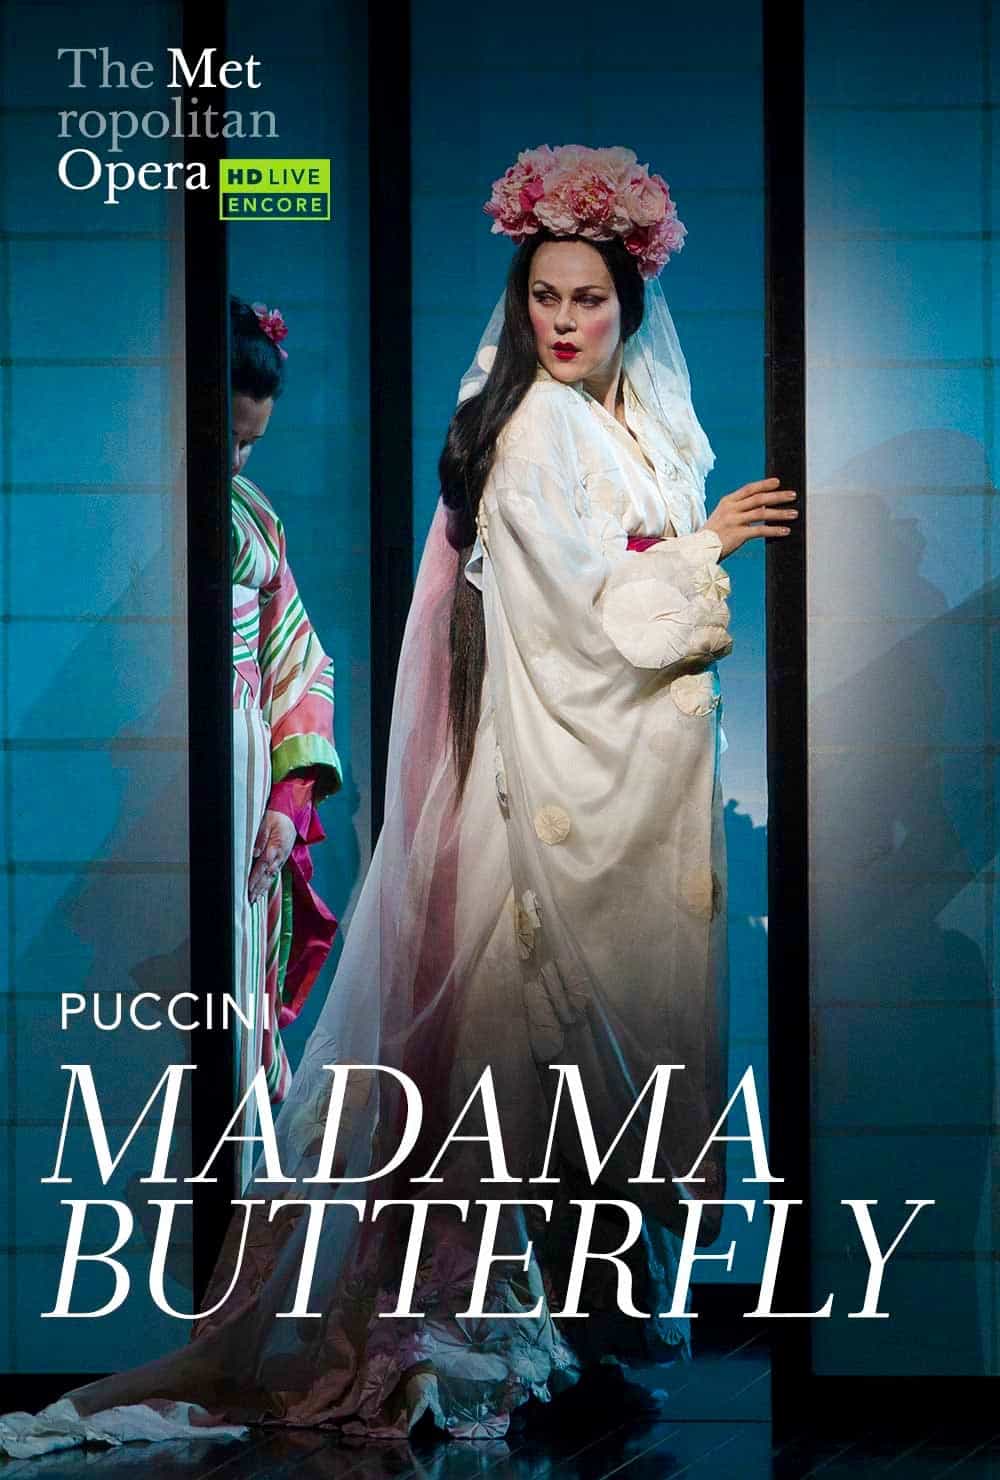 | Madama Butterfly: Met Opera 2016 (2016) | £421,695 | £421,695 | £421,695 | new | 1 |
| 8 (6) |  | London Has Fallen (2016) | £306,811 | £706,986 | £10,239,839 | -46% | 5 |
| 9 (7) | 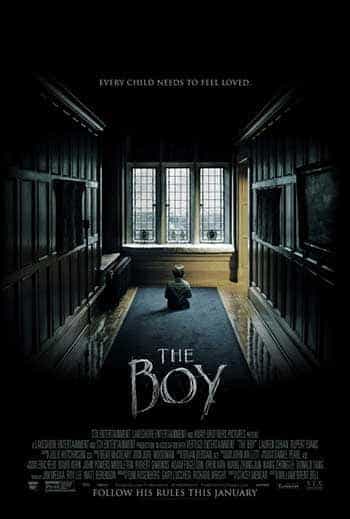 | The Boy (2016) | £273,459 | £567,245 | £2,122,429 | -20% | 3 |
| 10 (8) |  | The Divergent Series: Allegiant (2016) | £161,354 | £431,923 | £4,362,709 | -48% | 4 |
| 11 (9) |  | High Rise (2016) | £149,472 | £373,426 | £1,503,532 | -45% | 3 |
| 12 (10) | 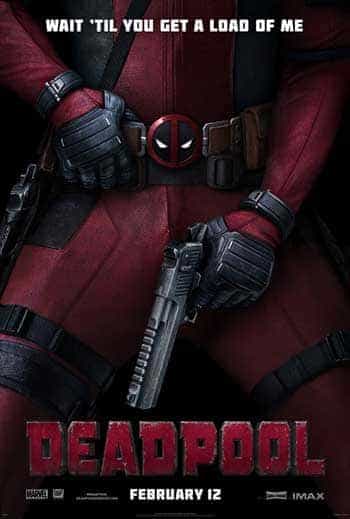 | Deadpool (2016) | £123,310 | £276,716 | £37,616,432 | -40% | 8 |
| 13 (new) | | Ki and Ka (2016) | £116,958 | £116,958 | £116,958 | new | 1 |
| 14 (new) | | Victoria (2016) | £108,602 | £108,602 | £108,602 | new | 1 |
| 15 (14) | 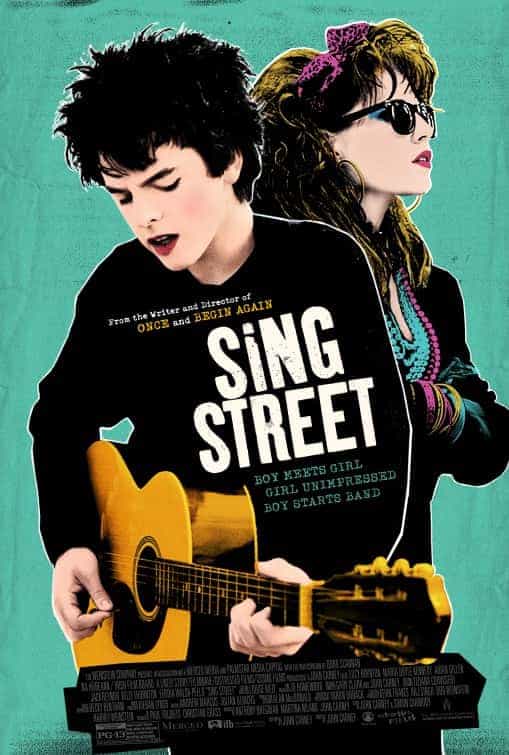 | Sing Street (2016) | £94,594 | £191,784 | £572,126 | 1% | 3 |


