| Title | Weekend | Week | Total | % Change | Total Weeks |
| 1 (3) |  | Me Before You (2016) | £1,453,859 | £2,687,343 | £4,478,000 | -19% | 2 |
| 2 (2) |  | Teenage Mutant Ninja Turtles: Out of the Shadows (2016) | £840,868 | £1,306,322 | £4,801,767 | -76% | 2 |
| 3 (4) |  | Alice Through the Looking Glass (2016) | £832,914 | £1,303,636 | £8,306,639 | -38% | 3 |
| 4 (1) | 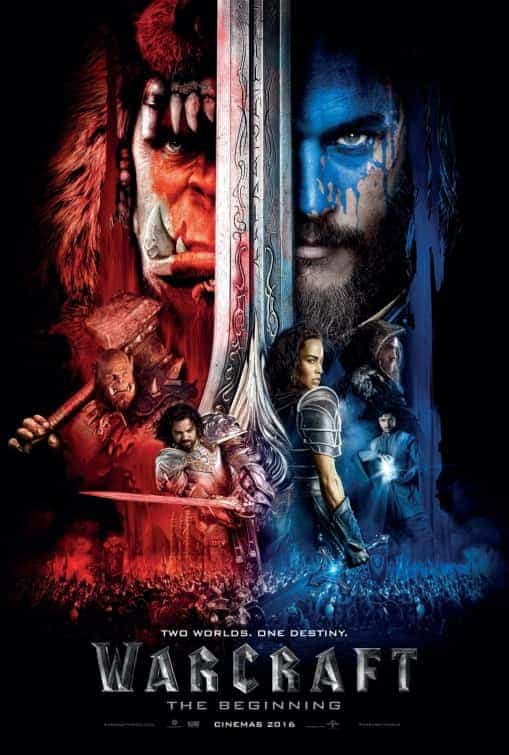 | Warcraft (2016) | £728,168 | £1,398,586 | £5,022,284 | -80% | 2 |
| 5 (5) | 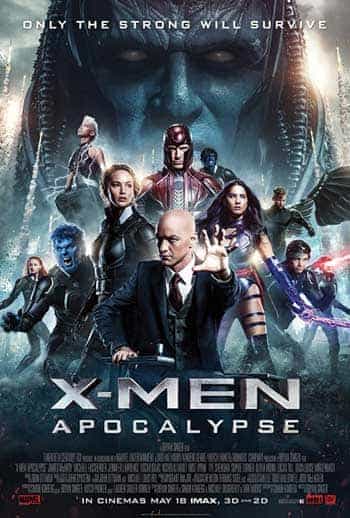 | X-Men: Apocalypse (2016) | £703,505 | £1,212,595 | £17,067,686 | -44% | 4 |
| 6 (6) | 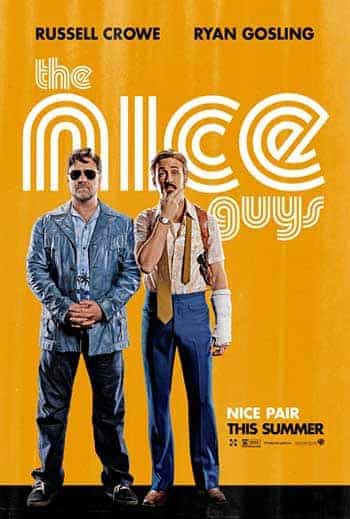 | The Nice Guys (2016) | £641,684 | £1,228,012 | £2,232,634 | -36% | 2 |
| 7 (new) |  | The Boss (2016) | £594,672 | £594,672 | £594,672 | new | 1 |
| 8 (7) |  | The Angry Birds Movie (2016) | £579,144 | £730,832 | £9,430,115 | -32% | 5 |
| 9 (new) |  | Mother's Day (2016) | £419,532 | £419,532 | £419,532 | new | 1 |
| 10 (8) |  | The Jungle Book (2016) | £412,358 | £530,329 | £45,111,681 | -28% | 9 |
| 11 (9) | 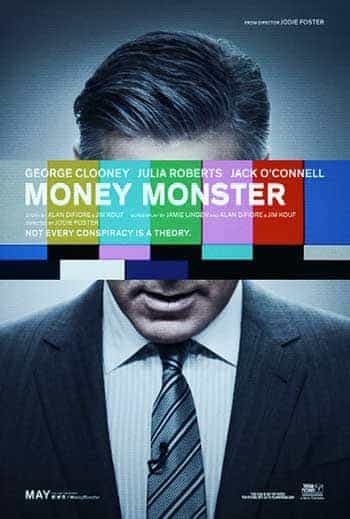 | Money Monster (2016) | £179,332 | £391,706 | £2,387,743 | -51% | 3 |
| 12 (12) |  | Love and Friendship (2016) | £170,296 | £328,821 | £1,172,393 | -29% | 3 |
| 13 (11) |  | Captain America: Civil War (2016) | £147,485 | £237,351 | £36,771,782 | -43% | 7 |
| 14 (new) | | When Marnie Was There (2014) | £99,352 | £99,352 | £99,352 | new | 1 |
| 15 (13) | 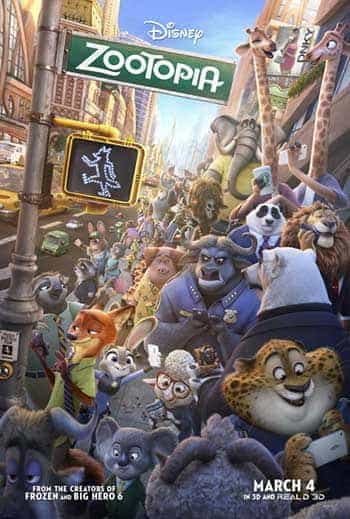 | Zootopia (2016) | £87,842 | £99,009 | £23,560,056 | -54% | 11 |


