UK Box Office 9th June, 2017
| Title | Weekend | Week | Total | % Change | Total Weeks | ||
| 1 (1) |  | Wonder Woman (2017) | £3,480,956 | £6,661,385 | £12,841,001 | -44% | 2 |
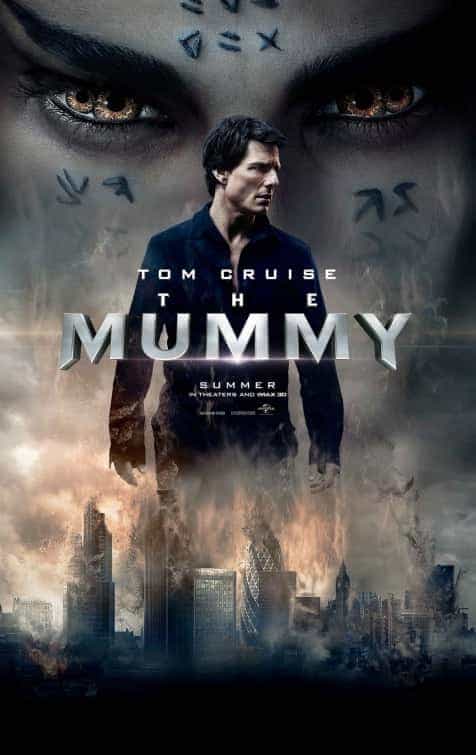
| 2 (new) |  | The Mummy (2017) | £3,343,650 | £3,343,650 | £3,343,650 | new | 1 |
| 3 (3) |  | Pirates of the Caribbean: Salazars Revenge (2017) | £1,487,705 | £2,974,184 | £16,007,456 | -46% | 3 |
| 4 (2) |  | Baywatch (2017) | £1,139,773 | £2,352,592 | £6,983,836 | -75% | 2 |
| 5 (new) |  | Take That: Wonderland Live From the O2 (2017) | £1,004,918 | £1,004,918 | £1,004,918 | new | 1 |
| 6 (new) |  | My Cousin Rachel (2017) | £637,704 | £637,704 | £637,704 | new | 1 |
| 7 (4) |  | Diary of a Wimpy Kid: The Long Haul (2017) | £508,394 | £912,300 | £4,845,138 | -40% | 3 |
| 8 (5) |  | Guardians of the Galaxy Vol. 2 (2017) | £305,740 | £646,863 | £40,293,853 | -52% | 7 |
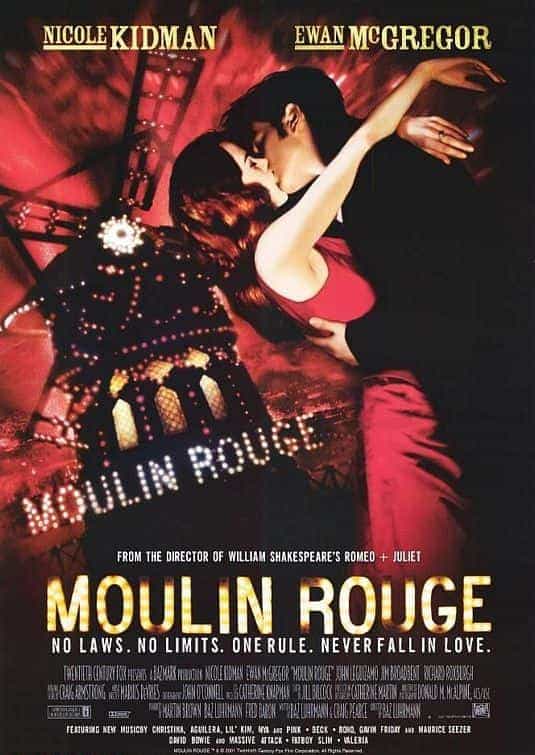
| 9 (9) |  | Moulin Rouge (2001) Secret Cinema | £163,474 | £232,371 | £4,484,897 | 19% | 28 |
| 10 (7) |  | The Boss Baby (2017) | £155,512 | £269,544 | £28,190,391 | -47% | 10 |
| 11 (new) | Peter Pan: NT Live 2017 (2017) | £119,127 | £119,127 | £119,127 | new | 1 | |
| 12 (18) |  | Beauty and the Beast (2017) | £101,981 | £118,937 | £72,263,904 | 55% | 13 |
| 13 (new) |  | The Shack (2017) | £96,580 | £96,580 | £96,580 | new | 1 |
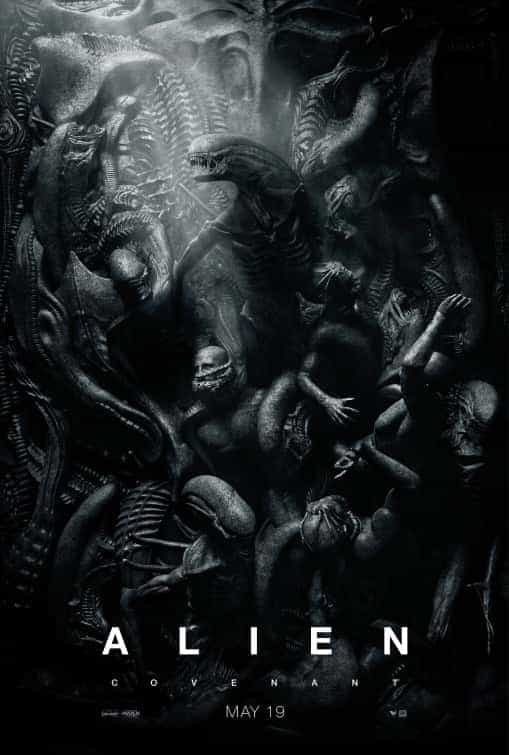
| 14 (6) |  | Alien: Covenant (2017) | £88,488 | £367,171 | £12,687,676 | -73% | 5 |
| 15 (12) |  | Smurfs: The Lost Village (2017) | £69,242 | £91,795 | £5,522,295 | -22% | 10 |