| Title | Weekend | Week | Total | % Change | Total Weeks |
| 1 (4) |  | The Greatest Showman (2017) | £2,201,523 | £3,261,363 | £23,226,869 | 7% | 6 |
| 2 (2) |  | Coco (2018) | £1,651,929 | £2,056,549 | £10,221,949 | -29% | 3 |
| 3 (1) |  | Darkest Hour (2018) | £1,638,984 | £3,457,869 | £18,682,098 | -39% | 4 |
| 4 (5) |  | Early Man (2018) | £1,502,262 | £1,907,829 | £3,928,482 | -26% | 2 |
| 5 (3) |  | Maze Runner: The Death Cure (2018) | £1,350,666 | £2,073,768 | £4,321,683 | -40% | 2 |
| 6 (new) |  | Den of Thieves (2018) | £1,082,560 | £1,082,560 | £1,082,560 | new | 1 |
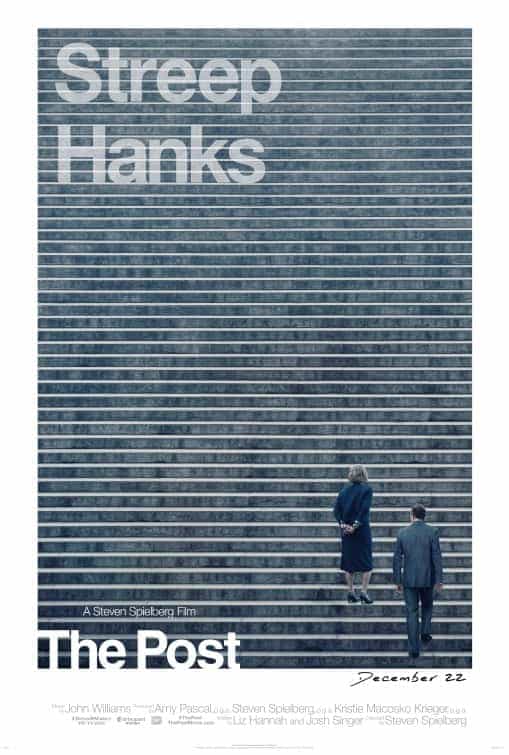
| 7 (6) |  | The Post (2018) | £960,487 | £2,013,799 | £7,223,655 | -40% | 3 |
| 8 (7) |  | Three Billboards Outside Ebbing, Missouri (2018) | £884,478 | £1,829,541 | £9,435,132 | -29% | 4 |
| 9 (8) |  | Jumanji: Welcome to the Jungle (2017) | £874,788 | £1,196,300 | £35,343,483 | -28% | 7 |
| 10 (new) |  | Phantom Thread (2018) | £727,104 | £727,104 | £727,104 | new | 1 |
| 11 (10) |  | Padmaavat (2018) | £405,352 | £707,907 | £1,558,293 | -52% | 2 |
| 12 (new) |  | Winchester (2018) | £373,550 | £373,550 | £373,550 | new | 1 |
| 13 (9) |  | Downsizing (2018) | £373,267 | £790,718 | £1,922,405 | -67% | 2 |
| 14 (11) |  | The Commuter (2018) | £275,707 | £613,355 | £3,643,253 | -58% | 3 |
| 15 (12) |  | Insidious: The Last Key (2018) | £218,000 | £458,762 | £5,040,843 | -57% | 4 |


