| Title | Weekend | Week | Total | % Change | Total Weeks |
| 1 (new) | 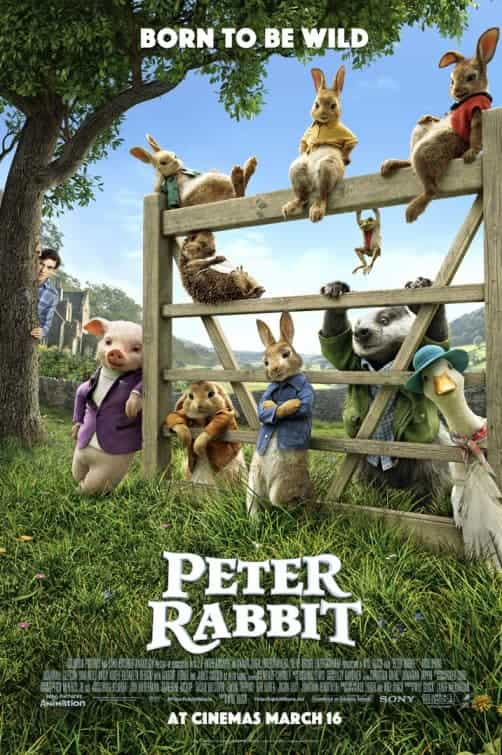 | Peter Rabbit (2018) | £7,273,207 | £7,273,207 | £7,273,207 | new | 1 |
| 2 (new) |  | Tomb Raider (2018) | £3,081,916 | £3,081,916 | £3,081,916 | new | 1 |
| 3 (1) |  | Black Panther (2018) | £1,881,691 | £2,949,122 | £42,779,145 | -36% | 5 |
| 4 (2) |  | The Greatest Showman (2017) | £1,059,983 | £1,567,303 | £38,904,203 | -32% | 12 |
| 5 (3) | 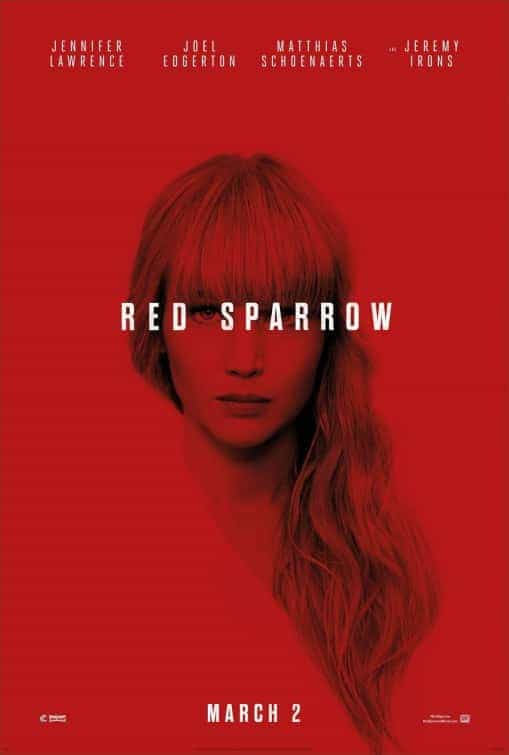 | Red Sparrow (2018) | £588,634 | £1,258,505 | £5,278,099 | -50% | 3 |
| 6 (4) |  | Game Night (2018) | £540,977 | £1,009,592 | £3,650,285 | -23% | 3 |
| 7 (5) |  | Lady Bird (2017) | £293,131 | £729,417 | £4,702,917 | -58% | 4 |
| 8 (7) |  | The Shape of Water (2018) | £289,641 | £628,832 | £6,978,097 | -48% | 5 |
| 9 (6) | 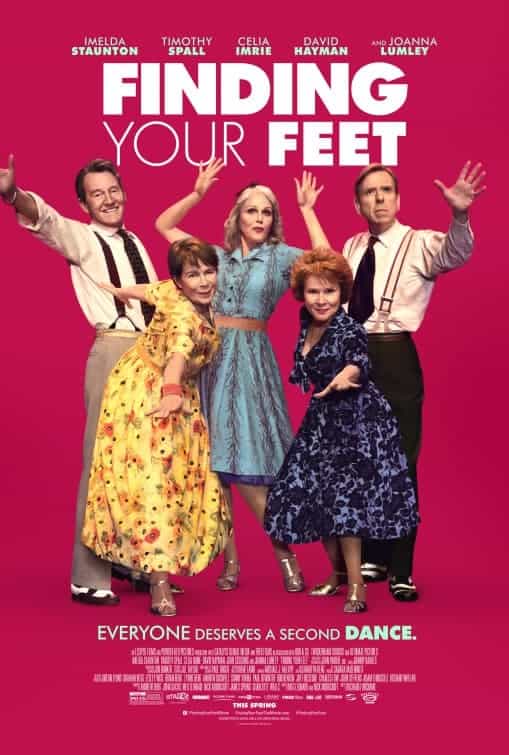 | Finding Your Feet (2018) | £285,202 | £890,323 | £4,437,675 | -50% | 4 |
| 10 (new) | | My Generation (2018) | £259,990 | £259,990 | £259,990 | new | 1 |
| 11 (new) | 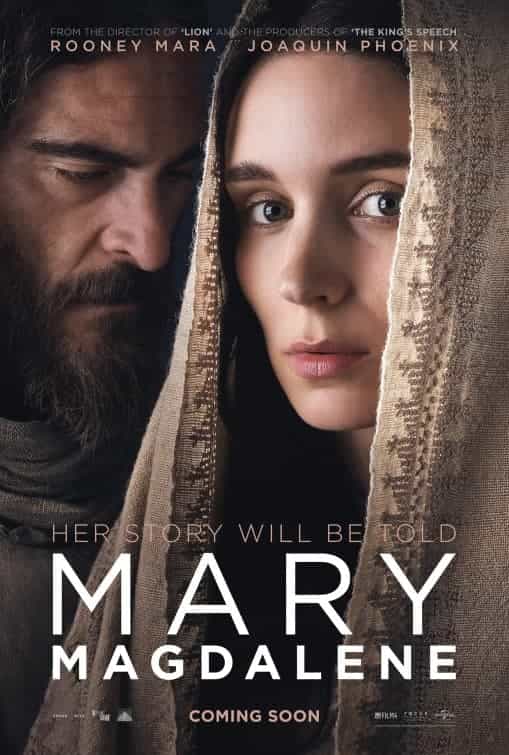 | Mary Magdalene (2018) | £238,924 | £238,924 | £238,924 | new | 1 |
| 12 (new) | | The Square (2018) | £221,256 | £221,256 | £221,256 | new | 1 |
| 13 (10) |  | Three Billboards Outside Ebbing, Missouri (2018) | £212,226 | £483,484 | £14,387,369 | -41% | 10 |
| 14 (9) |  | I, Tonya (2017) | £205,446 | £466,807 | £3,293,715 | -50% | 4 |
| 15 (8) | 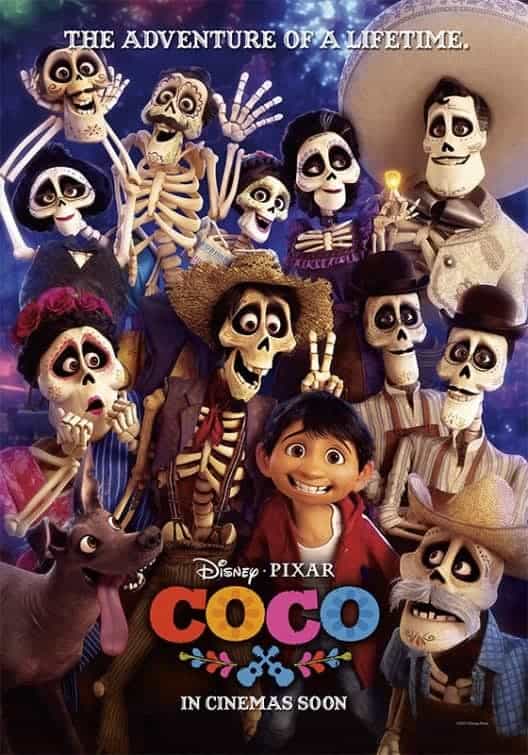 | Coco (2018) | £186,770 | £225,610 | £18,013,336 | -60% | 9 |


